


Research Summary: Improving Nearshore Bathymetric Surveys Using Satellite Images
01Department of Ecology, Evolution and Environmental Biology, Columbia University, New York
2The Nature Conservancy, Central Science Department, Arlington, VA
Bathymetry is traditionally done using an echo sounder fitted on the bottom of a boat. This method is accurate in measuring depth. However, its applicability is constrained by high operating cost, inefficiency, and inapplicability to shallow waters (Gao, 2009). Typical bathymetry models which lack data from shallow waters often extrapolate the lake bottom surface to the un-surveyed shores (Figure 1), but suffer from large uncertainties as a result (Wale et al.,2009). The resulting uncertainty can make it difficult to consistently enforce regulations that mandate minimum lake levels or river flows.

Figure 1. The storage characteristic of Lake Tana (Ethiopia) based on the 2006 survey. The live storage (portion of the reservoir available for use) between elevation 1784.6 and elevation 1787 m above sea level is beyond the survey boundary making water volume estimation LSS reliable. (Credit: Essayas, et al.)
We developed and validated a simple technique that improves nearshore bathymetric surveys over Lake Tana, Ethiopia (Figure 2) using freely available and easily downloadable remote sensing data. The methodology can be applied where traditional bathymetric surveys cannot reach shores due to operational limitation.

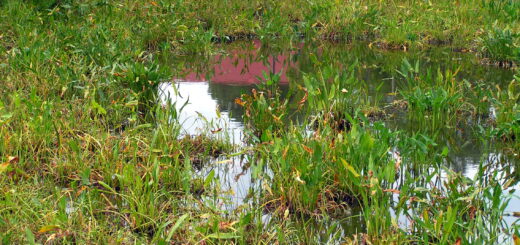
Figure 2. MODIS 250 m true colour image of Lake Tana (11 June, 2002). A large turbid plume is flowing into the lake at bottom left, turning the water reddish brown and making it harder to distinguish turbid water from dry land. (Credit: Essayas, et al.)
Methods
We selected 47 MODIS/Terra version 5 images of 250m resolution red and near infrared (NIR) bands for January 2002 to December 2003 where the highest lake level variation took place. While Normalized Difference Vegetation Index (NDVI) is extensively used in mapping the extent of inundated areas (Huang et al., 2012, 2014; Chen et al., 2013; Kwak et al., 2012; Feng et al., 2012), sediment plumes from inflowing streams often limit the ability of NDVI to accurately detect shore area. However, combining NDVI maps with 500m resolution short wave infrared (SWIR) band Normalized Difference Water Index (NDWI) maps to form an Enhanced Water Index (EWI) helps in overcoming the challenge of distinguishing turbid water from dry land. According to the EWI metric, a pixel is assigned to ‘water’ if the NDVI is less than zero and the NDWI is greater than zero. In addition to enhancing the ability to distinguish turbid water from dry land relative to NDVI alone, the EWI also helps to overcome image defects such as clouds and bright reflections (especially using band 6 of the SWIR data).
The lake area was mapped using the EWI from 34 randomly selected images. These areas were compared to measurements of the lake level on the image dates to construct an area – elevation characteristic curve. The remaining 13 images were used to validate the accuracy of the model by comparing predicted to measured lake levels.
Results
Our model of the lake bottom revealed a steeper nearshore profile than the profile extrapolated from bathymetric data. Figure 3 shows that the extrapolation approach (top chart) is less accurate than the remote sensing approach (bottom chart) outlined here, especially at lower water levels.

Figure 3. (a) Lake level estimates using existing extrapolation approach (Dost et al., 2014) of Lake Tana (b) water level estimates using modified model with remotely sensed data. (Credit: Essayas, et al.)
The remote sensing approach reduced the root mean square error (RMSE) of the water level estimate from 0.83 meters using the existing model (which overestimates actual water availability) to 0.14 meter. This may seem like a relatively small improvement in estimation of lake level and storage volume. However, given the large surface area of the lake in high lake conditions a small change in lake level would change the outflow discharge significantly (Kebede et al. 2006).
Conclusions
We demonstrated that the use of satellite imagery to map water surface area improves estimates of lake area. These more accurate measurements of lake area were combined with measured water levels to develop a linear bathymetric model which outperforms the existing model (a cubic polynomial extrapolated from the traditional bathymetric data). MODIS/Terra version – 5 images were found to be well suited for mapping lake area due to relatively high temporal resolution. The high temporal resolution enables an analysis of the short term yet significant changes in lake area and monitoring of coastal areas with less effort than a field survey approach.
Full study published in the International Journal of Applied Earth Observation and Geoinformation, Volume 36, April 2015, pp. 13 – 21.
References
- Chen, Y., Huang, C., Ticehurst, C., Merrin, L., Thew, P., 2013. An evaluation of MODIS daily and 8-day composite products for floodplain and wetland inundation map-ping. Wetlands 33, 823–835.
- Dost, R., Maathuis, B., Ayana, E.K., 2014. Validation Techniques for Radar Altimeter Measurements Over Ungauged Inland Waters in the Ethiopian Highland and Rift Valley.
- Gao, J., 2009. Bathymetric mapping by means of remote sensing: methods, accuracy and limitations. Prog. Phys. Geogr. 33, 103–116.
- Huang, C., Wu, J., Chen, Y., Yu, J., 2012. Detecting floodplain inundation frequency using MODIS time-series imagery. In: 2012 First International Conference on Agro-Geoinformatics (Agro-Geoinformatics), IEEE, pp. 1–6.Huang, C., Chen, Y., Wu, J., 2014. Mapping spatio-temporal flood inundation dynamics at large river basin scale using time-series flow data and MODIS imagery. Int. J. Appl. Earth Observ. Geoinform. 26, 350–362.
- Kwak, Y., Park, J., Yorozuya, A., Fukami, K., 2012. Estimation of flood volume in Chao Phraya River basin, Thailand, from MODIS images coupled with flood inundation level. In: 2012 IEEE International Geoscience and Remote Sensing Symposium (IGARSS), IEEE, pp. 887–890.
- Kebede, Y. Travi, T. Alemayehu, V. Marc, Water balance of Lake Tana and its sensitivity to fluctuations in rainfall, Blue Nile basin, Ethiopia, Journal of Hydrology, 316 (2006) 233-247.
- Wale, A., Rientjes, T., Gieske, A., Getachew, H., 2009. Ungauged catchment contributions to Lake Tana’s water balance. Hydrol. Process. 23, 3682–3693.
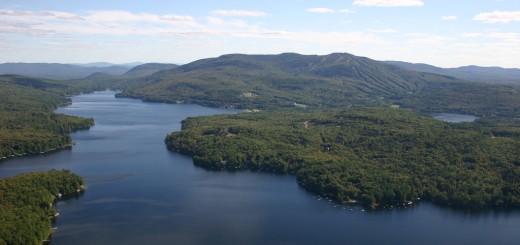
Featured Image: Lake Tana, Ethiopia. (Credit: Wikimedia Commons User Andro96 via Creative Commons 2.0)