


Dredge Turbidity Monitoring
0Overview
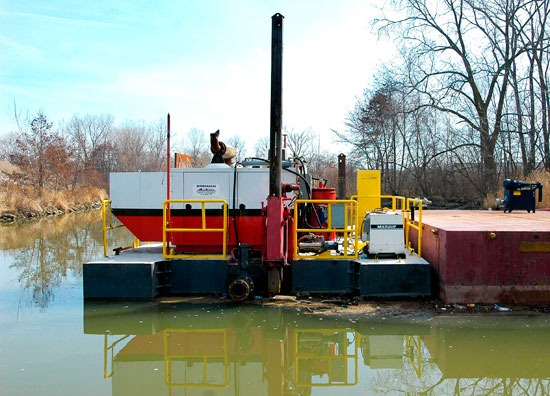
Dredging is an excavation activity carried out in shallow seas and freshwater areas (lakes and rivers) to gather up bottom sediment and dispose of it at a remote location. Oftentimes, dredging is done to reclaim areas affected by chemical spills, storm water surges (with urban runoff), and other soil contaminations.
During contaminated sediment dredge operations, regulations commonly require that systems are put in place for dredge turbidity monitoring to ensure the suspended sediment levels do not exceed pre-defined ranges. The purpose of the monitoring is to identify when an excessive amount of suspended solids are released into the water column as a result of excavation activities and slow down or cease dredge operations until suspended solids reach a suitable level.
Turbidity measurements are often used to monitor the total suspended sediment (TSS) in the water. Turbidity is defined as cloudiness or haziness of a fluid caused by individual particles or suspended solids. It is relatively difficult and many times cost-prohibitive to measure TSS directly; therefore, turbidity measurements have become the standard for monitoring suspended sediment in the field.
Selecting a Sensor
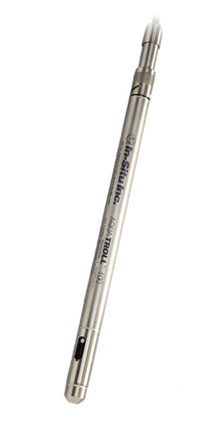
There are many turbidity sensors on the market. Common sensor manufacturers include Campbell Scientific, YSI, In-Situ, and Hydrolab. The Campbell Scientific OBS 3+ (formerly D&A Instruments) uses the optical backscatter method to measure turbidity and suspended solids.
The popular multi-parameter sondes offer optical turbidity sensors with self-cleaning wipers that reduce maintenance intervals. The model 6136 turbidity sensor from YSI has become the preferred sensor for many critical turbidity monitoring projects. Before taking a reading, a mechanical wiper cleans the sensing optics to ensure that the measurement is unaffected by fouling sediment debris.
Selecting a Location
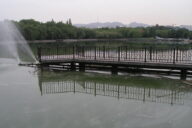
The location of turbidity monitor(s) depends largely on site conditions where the dredging will take place. If seawalls are located near the dredging operations, turbidity monitoring sensors can sometimes be mounted in a perforated PVC pipe along the seawall.
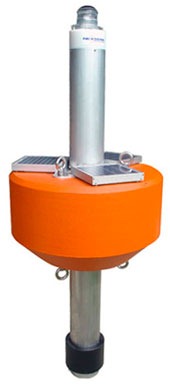
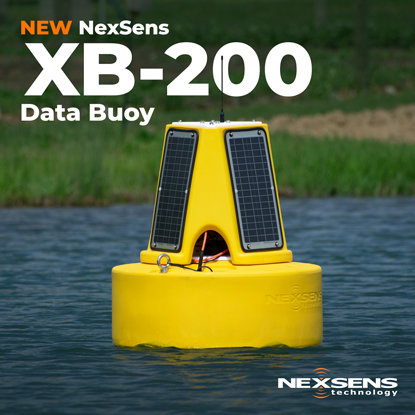
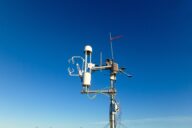
Oftentimes, site conditions make it difficult or impossible to mount the monitoring equipment along the shore. When this is the case, buoy-based systems offer the most cost-effective solution, such as NexSens MB-300 and MB-500 data buoys. These buoys are solar-powered and offer options for radio or cellular telemetry.
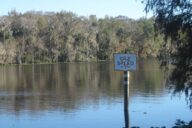
The number of monitoring locations depends on many factors; commonly, three buoy-based systems are used. An off-site, background monitor is deployed upstream from the dredging operations or at a location largely unaffected by the dredging. The background monitor serves as the control for suitable turbidity levels in the water.
Downstream from the dredge operations (or at locations directly affected by dredging), two monitors are strategically deployed to examine levels of suspended sediment as compared to the background monitor. If regulations require turbidity levels to be measured at multiple depths in the same location, the NexSens Turbidity Monitoring Buoys easily accommodate this need.
Alarm Notification
NexSens Turbidity Monitoring systems offer two types of alarms; software and data logger. Software alarms are used to notify persons via SMS text messaging or email of parameters exceeding pre-defined parameter limits. NexSens iChart Software sends the alarm when it receives data from the data logger. Data logger alarms are used to change the functionality of the data logger based on parameter inputs, such as changing sample and log intervals based on a particular logged reading.
To determine the turbidity parameter limits, background turbidity data is typically obtained prior to dredging using spot-sampling equipment. This is commonly achieved using a Hach 2100P portable field turbidimeter, which adheres to the EPA 180.1 method. Once the limits have been determined, the data is then entered into NexSens iChart Software. When the turbidity levels exceed this pre-defined range during operations, a text message or email is automatically sent to the appropriate project manager or dredge operator.
With this system in place, dredge operators can be notified immediately of high turbidity levels and slow down or alter the dredging operation until levels fall back within range. Additionally, the historical data can be tracked and correlated to dredge operations so that the consulting firm can improve upon future dredging operations.
Managing Data
Once the Turbidity Monitoring Systems are set up, data is logged at a user-defined interval (minimum 1 minute). The user also sets the interval at which data is transmitted via radio or cellular telemetry. A typical monitoring system logs turbidity data every 10 minutes and transmits data every 30 minutes.
Data is transmitted to a nearby (or remote) computer running iChart Software. iChart is a user-friendly software package that serves as the centralized interface and database for all incoming data. All data and sensor configuration settings are also stored in a single iChart database.
The software offers a unique historical report creation tool that can generate customized reports with data from all sensors in an iChart database. When creating a report, users can include specific information about the monitoring site, location, sensors, and project. After creation, reports can be converted to PDF, exported to Microsoft Excel, sent to interested parties via e-mail, uploaded to a web server, and more. The report template can also be saved and automatically generated, further automating the reporting process.
The NexSens WQData web datacenter is an optional service that automatically generates an online graphical interface for viewing, analyzing, and downloading data in real-time. This datacenter allows project members and stakeholders to remotely experience the project information and data in order to monitor turbidity during remediation activities.