


Research Brief: Evaluating Surface Wave Models in Lake Erie
0Lake Erie presents a unique challenge to wave modeling due to varying depths and weather conditions from one side of the lake to the other. There are a number of existing wave models that have been applied to the Great Lakes, such as SWAN, ELCOM, CAEDYM, COASTLINES, DELFT3D, among others.
A 2025 study published in the Earth and Space Science (ESS) Open Archives sought to set up and run a SWAN model of Lake Erie coupled with an existing DELFT3D hydrodynamic model to evaluate the success of the approach compared to other wave models and actual measurements during a 2020 storm event.1
The study also sought to identify the optimal bottom friction coefficient to simulate waves in Lake Erie.1

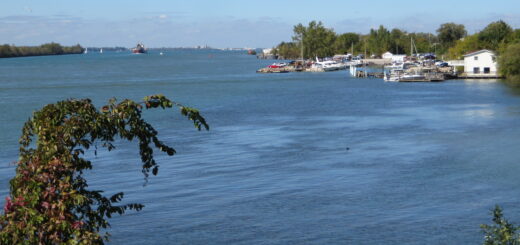
The waves of Lake Erie in Point Pelee National Park. (Credit: Jason Zhang via Wikimedia Commons CC BY-SA 3.0)
Methods
The combined model (DELFT3D-SWAN) was applied to hindcast a storm event that occurred on November 15, 2020, to validate the model’s “ability to simulate the significant wave height in Lake Erie and investigate the influence of bottom friction on surface waves.”1 The simulation period was from November 13-18, 2020.
Significant wave height from three deployed wave data buoys was compared to the DELFT3D-SWAN model in order to validate the model’s predictions. Validation of the model was based on its ability to simulate waves with the same or better performance than other models.
In order to determine the best bottom friction coefficient, six simulations with different coefficients were completed.
Results
Compared to the other wave models, the DELFT3D-SWAN model was determined to be valid as it simulates waves similarly or better than the other models in the Great Lakes.
In the western basin, results indicated that bottom friction did have an effect on predicted wave height during the storm event, with a coefficient of 0.15 m1/s3 being the most accurate to simulate waves in both typical weather conditions and during the storm event.1
In the eastern basin, bottom friction had little effect when wave heights were under 3.75 m, though during the storm event, a coefficient of 0.03 m2/s3 was most accurate.1
In the central basin, wave height varied with bottom friction. If waves were between 2.5 m and 4.0 m, a 0.067 m1/s3 performed best. However, if waves exceed 4.0 m, then 0.15 m1/s3 was more accurate. The study concludes that a 0.067 m1/s3 coefficient was best for simulating the full storm event.1
Ultimately, the bottom friction coefficient that performed best across basins under typical weather conditions was 0.067 m1/s3–however, if wave heights exceed 3 m, it is recommended to change the bottom friction coefficient based on the above information.
The study concludes by proposing that future hindcasting will help further determine the accuracy of the model, particularly at shallower depths, in addition to investigating the role of bottom friction coefficients in these environments.
The above study is based on a preprint version of the study submitted to the ESS Open Archive.
Source
- Green, Olivia & Mulligan, Ryan & Boegman, Leon. (2025). Modelling Surface Waves in Lake Erie. 10.22541/essoar.174554379.99505435/v1.