


Part of being able to understand the Great Lakes is the ability to model and predict their behaviors accurately. Researchers use multiple models to learn about the Great Lakes, and one thing that all of the models have in common and rely on to run is data. Much of the Great Lakes modeling data is collected through data buoys in the warmer seasons. However, buoys are typically removed from the water during the winter to protect the equipment from damage due to weather and temperature conditions. Without buoys in the winter, data gathering is limited and thus often creates gaps in understanding the Great Lakes. However, these gaps can be filled using satellite data and models.
(Credit: Linfeng Li)
A researcher at the University of Michigan seeks to fill the gaps left by missing buoys in the winter by using novel satellite measurements to empower winter wave data gathered in the Great Lakes. Graduate student Linfeng Li and their research advisor, Ayumi Fujisaki-Manome, gathered data on high-wave events in the Great Lakes from April 2021 to December 2021. The team compared data from buoys stationed in the Great Lakes, the WAVEWATCHIII model and ICESat-2 (Ice, Cloud, Land Elevation Satellite-2). Overall, the multi-data approach allowed the team to test the accuracy and validity of both the WAVEWATCHIII model and ICESat-2.
Accurately gathering Great Lakes wave data is important for coastal and shoreline communities around the lakes who may suffer from flooding and storm events. Ultimately, the goal of the research was to determine if satellite data can be used to appropriately supplement buoy data in the winter, as well as being an additional source of data that is comparable to in-situ buoy data. The researchers hypothesized that satellite data would be just as effective as data collected by buoys and models.
Methods
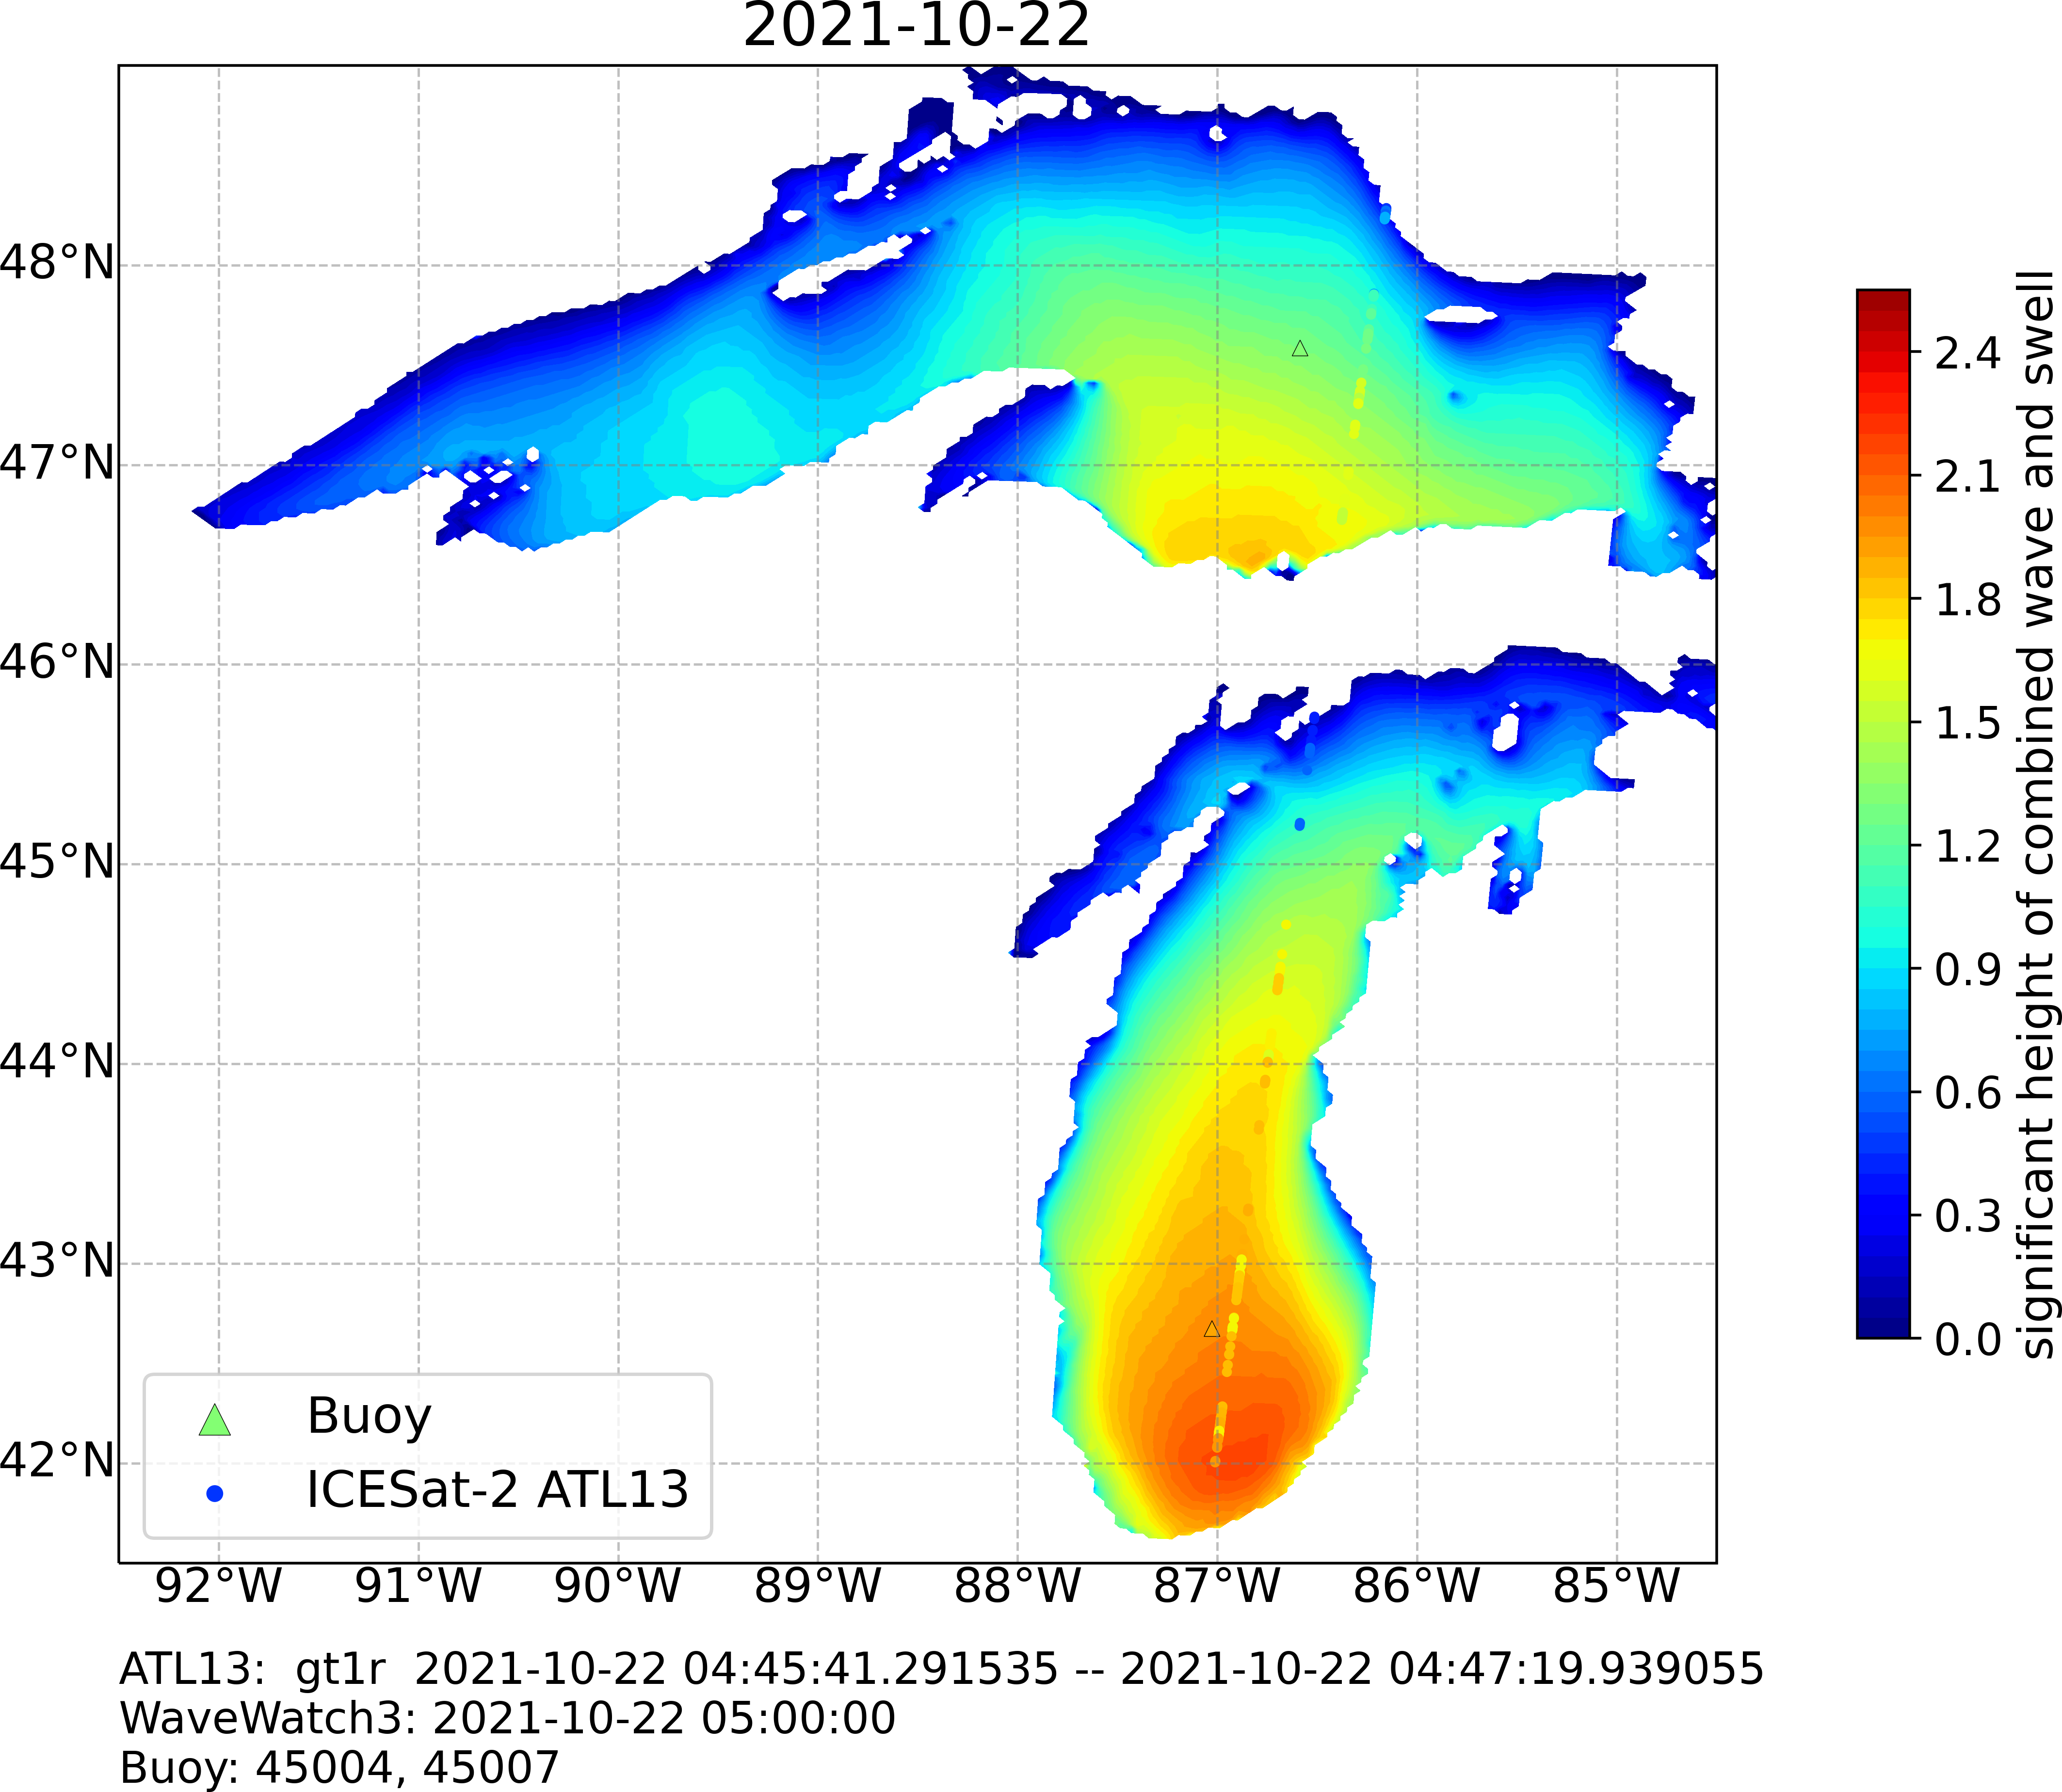
Wave height data from the ICESat-2 satellite was compared to buoy data in Lake Huron based on close timing and location. Li explains, “The data points were plotted on a map with colors showing the magnitude to produce a visualized comparison.” An example of this visualization is seen in Figure 1. Wherein, the color of the data indicates wave height, as measured by buoy and satellite data. The data appears consistent across methods, showing that one or both are valid forms of measuring wave height.
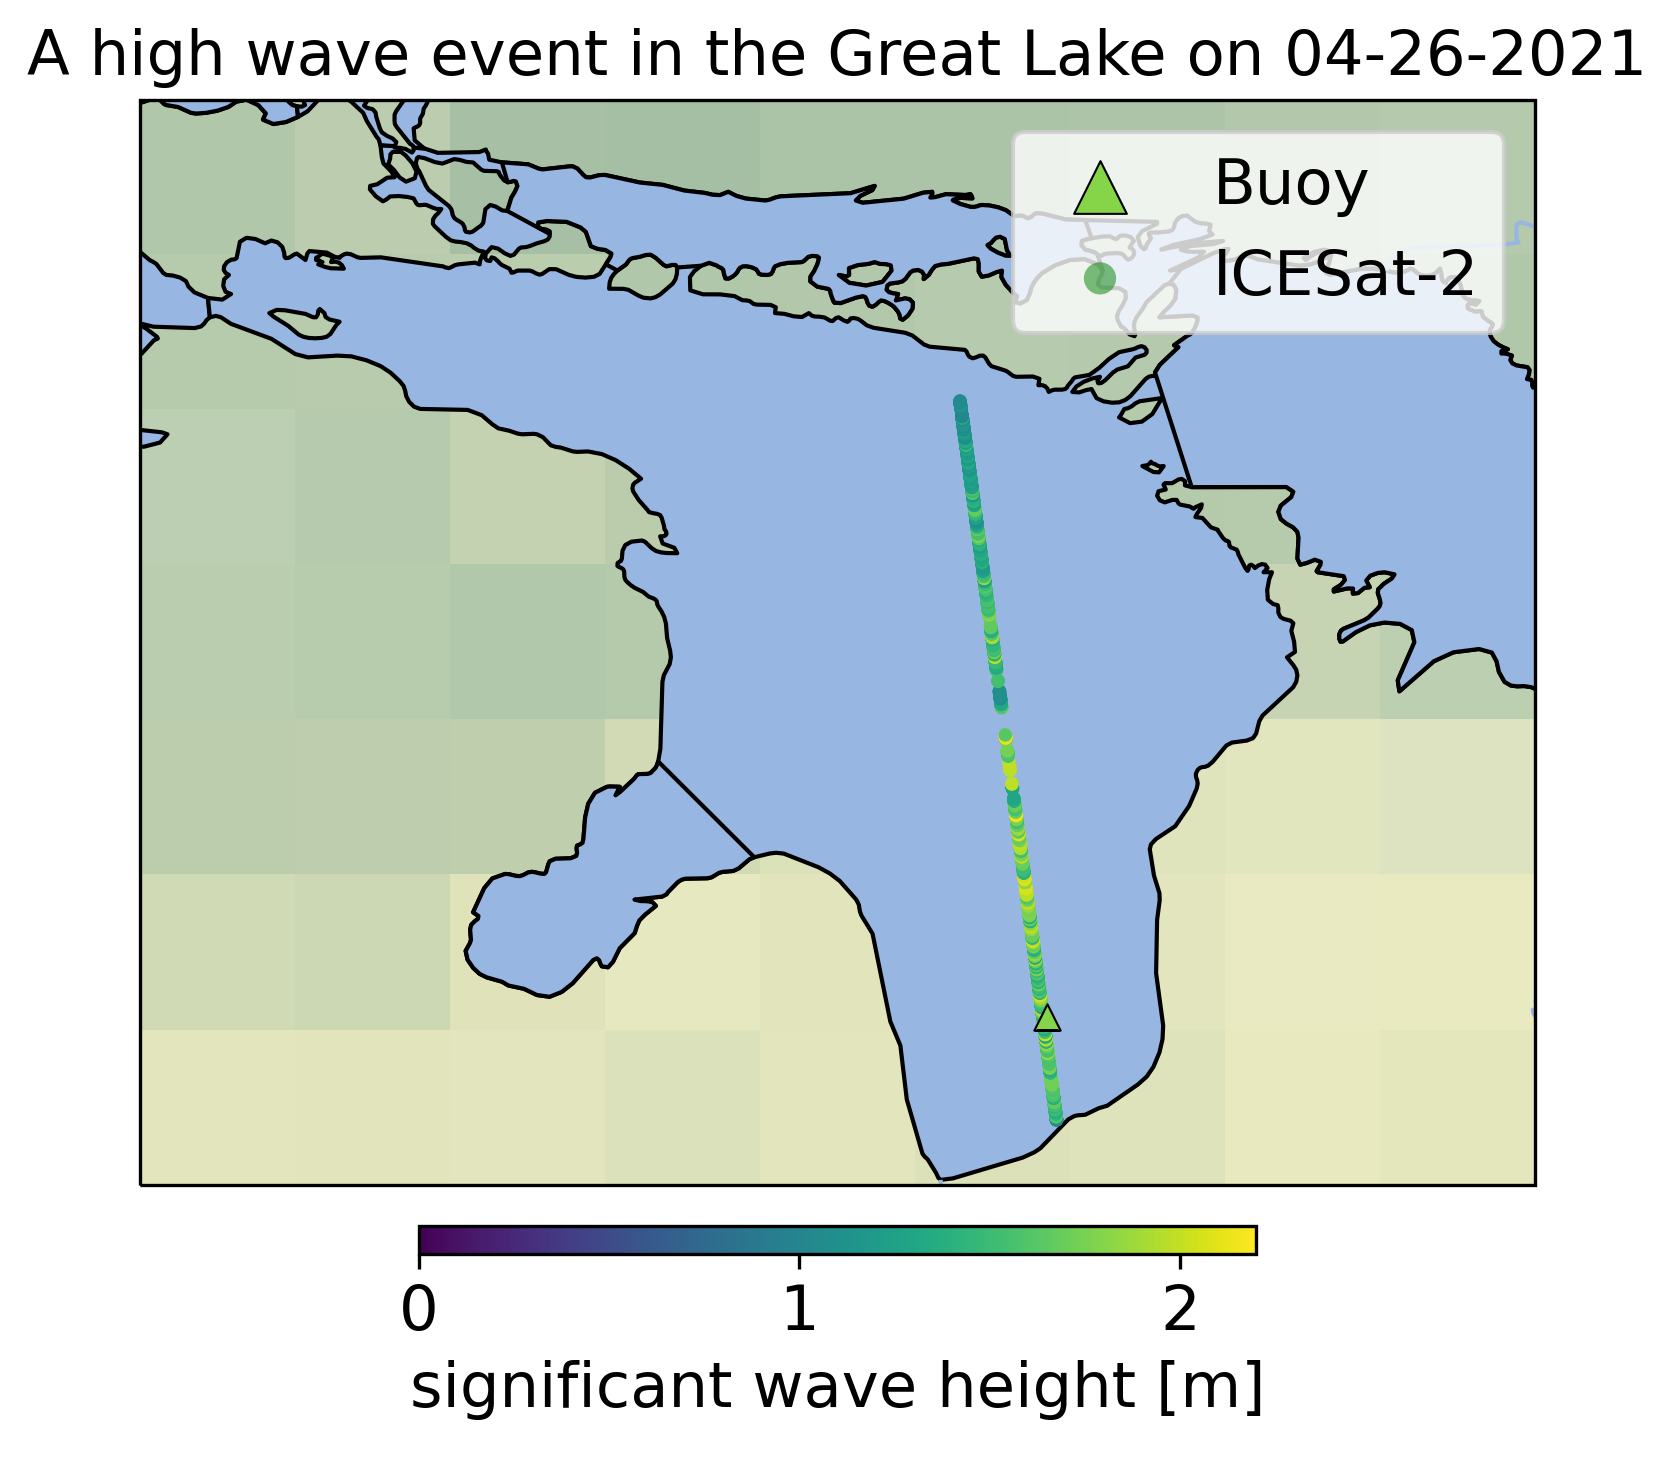
Figure 1: Significant wave height from a buoy and the satellite within Lake Huron on 4/26/2021 (Credit: Linfeng Li)
Li also used the WAVEWATCHIII model to report wave heights throughout the Great Lakes. The model resembles a topographical map, with colors signifying high to low wave heights, similar to how land masses are displayed. Comparable to the buoy data, the model’s results complemented those of the satellite data, as there are similar colors at adjacent locations.
Conclusion
The results of this study affirm that wave height measured by the ICESat-2 satellite is consistent with buoy data and functions as a means of verifying the WAVEWATCHIII model. At the same time, the results of this study warn that the WAVEWATCHIII model can accurately predict wave heights lower than 1.5 meters but overestimates waves larger than 1.5 m. Li will present this research at the 22nd Annual American Meteorological Society (AMS) Student Conference January 7-8, 2023, the weekend before the main AMS annual meeting.
Featured Photo Credit: (Credit: NASA, CC BY 2.0)