


With air temperature increases reported nearly every year, there’s been a global shift in interest toward understanding how thermal vulnerability impacts ecosystems, habitats and organisms. In particular, it’s become increasingly important to examine the vulnerability of aquatic habitats in response to warming. “Mountain streams sustain unique ecosystems and are important sources of drinking water, culture, and recreation, all of which may be affected by warming.”1,2,3 In order to fully grasp the effects of climate change, it’s important to determine and understand how thermal vulnerability varies in stream networks.4 For the purposes of this study, temperature vulnerability (or thermal vulnerability) refers to the combination of a species’ sensitivity to temperature and its exposure to temperature.1
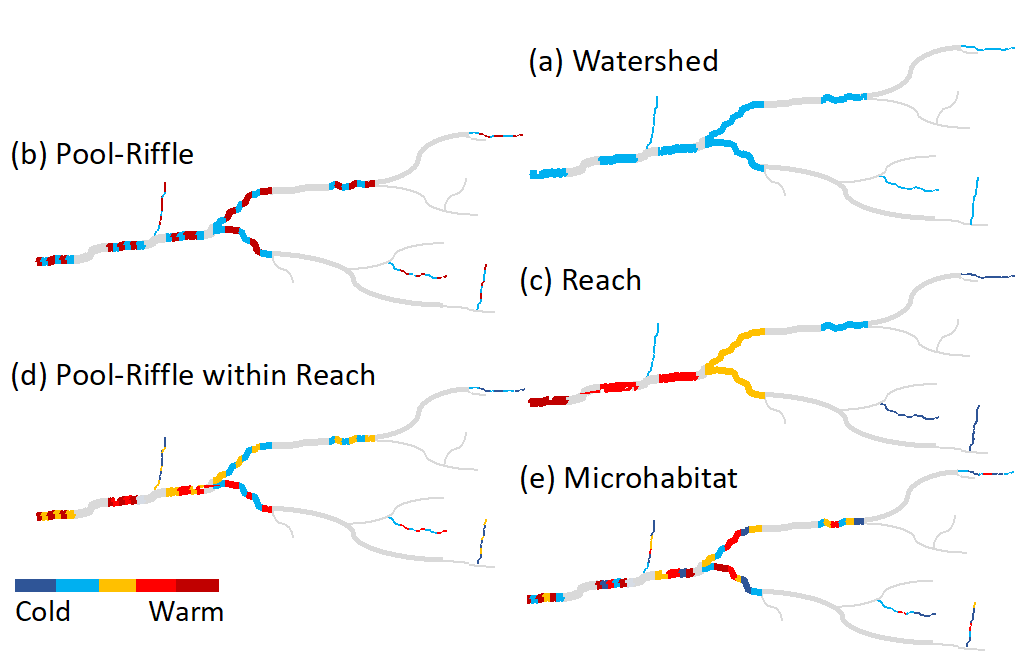
The ten reaches are colored according to temperature at a given time step to demonstrate possible scales of variation (Credit: Leathers et al., 2022)
A 2022 study examined space and time variances in thermal vulnerability in the southern part of the Sierra Nevada mountain range. More specifically, the research examined the Bull Creek stream network, a watershed in the Kings River Experimental Watersheds. The system was chosen because it is comprised of various habitat types. “Habitats within Bull Creek range from meadow-dominated headwaters to Sierra mixed-conifer forest bordered mainstems, and the watershed geology consists of Cagwin soils, derived from granite.”1,5
The study aimed to answer the following research questions using data gathered from year-long surveillance of temperature data measurements in Bull Creek:
- How does thermal sensitivity change during and between seasons in a mountain watershed system?
- At what spatial scale do thermal regimes (or the typical patterns of temperature variances) vary?
- “What is the relative effect of ‘local’ conditions vs. upstream water temperature in driving spatial variation in maximum water temperature?”1
- How will temperature variances and increases worsen due to future climate change and impact sensitive invertebrate taxa?
Method
In July 2020, the researchers deployed 120 Onset Mx2202 for 12 months, logging temperature and light data every 15 minutes. The use of these sensors allowed researchers to examine a variety of thermal regimes from microhabitat scales to the whole watershed. Each water temperature sensor was deployed concurrently with a land-stationed air temperature sensor. The research team also gathered complimentary environmental data for each sensor site, including canopy cover, conductivity, elevation, stream width, depth, velocity, and channel morphology.
Researchers used temperature data to make predictions for future warming scenarios. They then compared these predictions to known temperature sensitive macroinvertebrate taxa living in the watershed to determine how these organisms would be impacted by the shift.
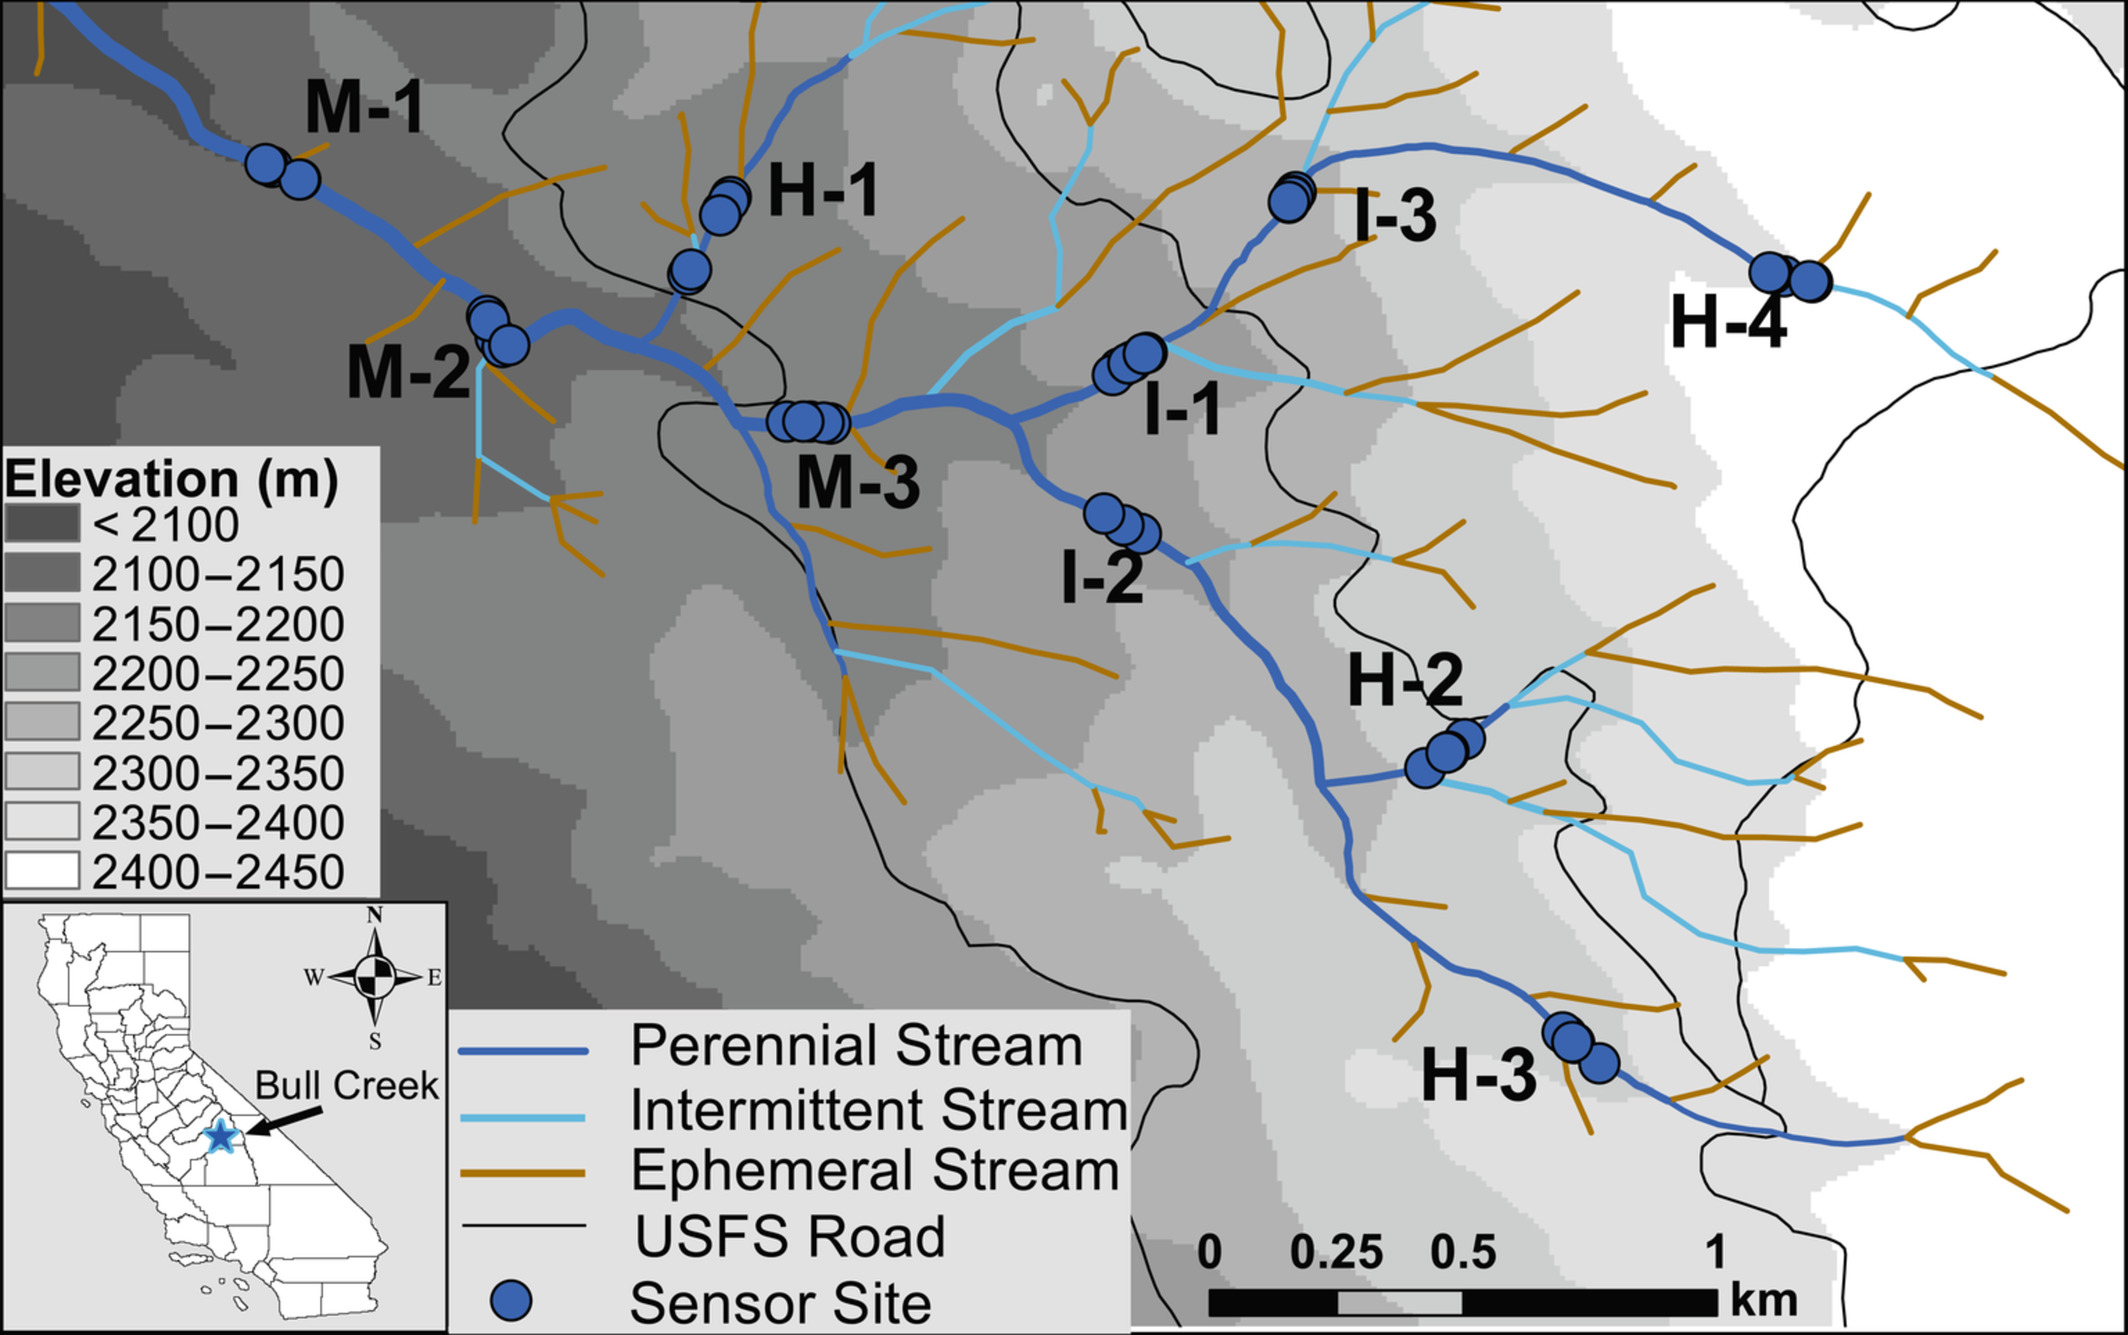
Map of study sites in Bull Creek watershed, California, following a nested spatial design. Each of the 10 reaches had three pairs of pool-riffle sites (often overlapping in the representation due to mapping exact GPS coordinates) (Credit: Leathers et al., 2022)
Results
Data gathered supports the team’s hypotheses. First, the team believed thermal sensitivity would be time-varying and peak alongside air temperate during the summer months. The premise was upheld as both mean air and water temperature peaked in late July and August. Second, the team believed that the individual reach scales (based on watershed, pool-riffle or microhabitats) would explain the spatial variance in temperature due to groundwater influence and channel morphology. Unsurprisingly, examining the Bull Creek system through multiple reaches uncovered thermal regimes that varied across reach scales.
Third, elevation did play a role in influencing the local maximum water temperature. Higher elevations reduce air temperature and shift precipitation to snow, canopies impede solar radiation, and deep pools provide greater thermal buffering–keeping high-elevation waters cooler. Therefore, upstream conditions played a larger role in influencing water temperature nearby, meaning differences are more attributable to upstream distance rather than local abiotic conditions. Finally, thermal sensitive invertebrates were found to be out at risk as cold-water habitat availability continue to decline.
The hotter months of July and August showed peak mean temperatures of 21.2ᵒ C for air and 16.8ᵒ C for stream temperature.1 Water temperature varied depending on the range being assessed, with headwaters showing the greatest differences. In contrast, air temperature showed fewer differences, suggesting that upstream water temperature had a larger influence (compared to local air temperature) on downstream temperature. These months were likely the most thermally stressful for aquatic insects.
The researcher determined the preferred habitat temperatures for the overall community and the more sensitive Ephemeroptera, Plecoptera, and Trichoptera subsets. After determining the range of temperatures, the team looked to their future predictions and found that conditions weren’t promising. The team predicted, “A thermal mismatch by the end of the century that may threaten or locally extirpate up to 27.2% of macroinvertebrate taxa.” 1 Such a loss would have major implications for the rest of the ecosystem as an even greater percentage of species could face thermal stress, further impacting the population. In order to better understand how these losses might impact local ecology, greater sampling and more diverse studies must be conducted.
Source
- Leathers, K., Herbst, D., Safeeq, M. and Ruhi, A. (2022), Dynamic, downstream-propagating thermal vulnerability in a mountain stream network: Implications for biodiversity in the face of climate change. Limnol Oceanogr. https://doi.org/10.1002/lno.12264
- Isaak, D. J., M. K. Young, D. E. Nagel, D. L. Horan, and M. C.Groce. 2015. The cold-water climate shield: Delineatingrefugia for preserving salmonidfishes through the 21st cen-tury. Global Change Biol.21: 2540–2553. doi:10.1111/gcb.12879
- Vlach, V., O. Ledvinka, and M. Matouskova. 2020. Changinglowflow and streamflow drought seasonality in centralEuropean headwaters. Water12: 3575. doi:10.3390/w12123575
- Clusella-Trullas, S., R. A. Garcia, J. S. Terblanche, and A. A.Hoffmann. 2021. How useful are thermal vulnerabilityindices? Trends Ecol. Evol.36: 1000–1010. doi:10.1016/j.tree.2021.07.001
- Hunsaker, C. T., T. W. Whitaker, and R. C. Bales. 2012. Snow-melt runoff and water yield along elevation and tempera-ture gradients in California’s Southern Sierra Nevada.J. Am. Water Resour. Assoc.48: 667–678. doi:10.1111/j.1752-1688.2012.00641.x
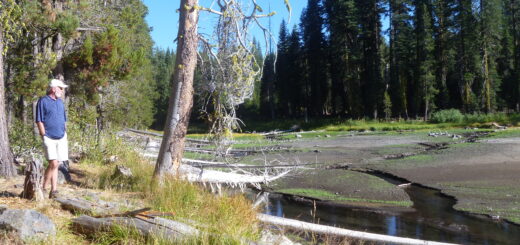
Featured Image: The Sierra Nevada River (Credit: Vic Vu, via Flickr CC BY-SA 2.0)