


Research Brief: Monitoring and Predicting CyanoHABs using Sentinel-3 OLCI Satellite Imagery
0Cyanobacterial harmful algal blooms (cyanoHABs) monitoring has evolved past the discrete sampling followed by lab analyses to real-time measurements and satellite observations. High-frequency satellite data, as provided by the Sentinel-3 Ocean and Land Color Imager (OCLI), has become a popular observation tool and resource in HABs research.
A 2024 study published in Remote Sensing explored the use of a Random Forest model to evaluate the performance of Sentinel-3 OCLI images in predicting cyanoHABs in the western region of Lake Erie.1
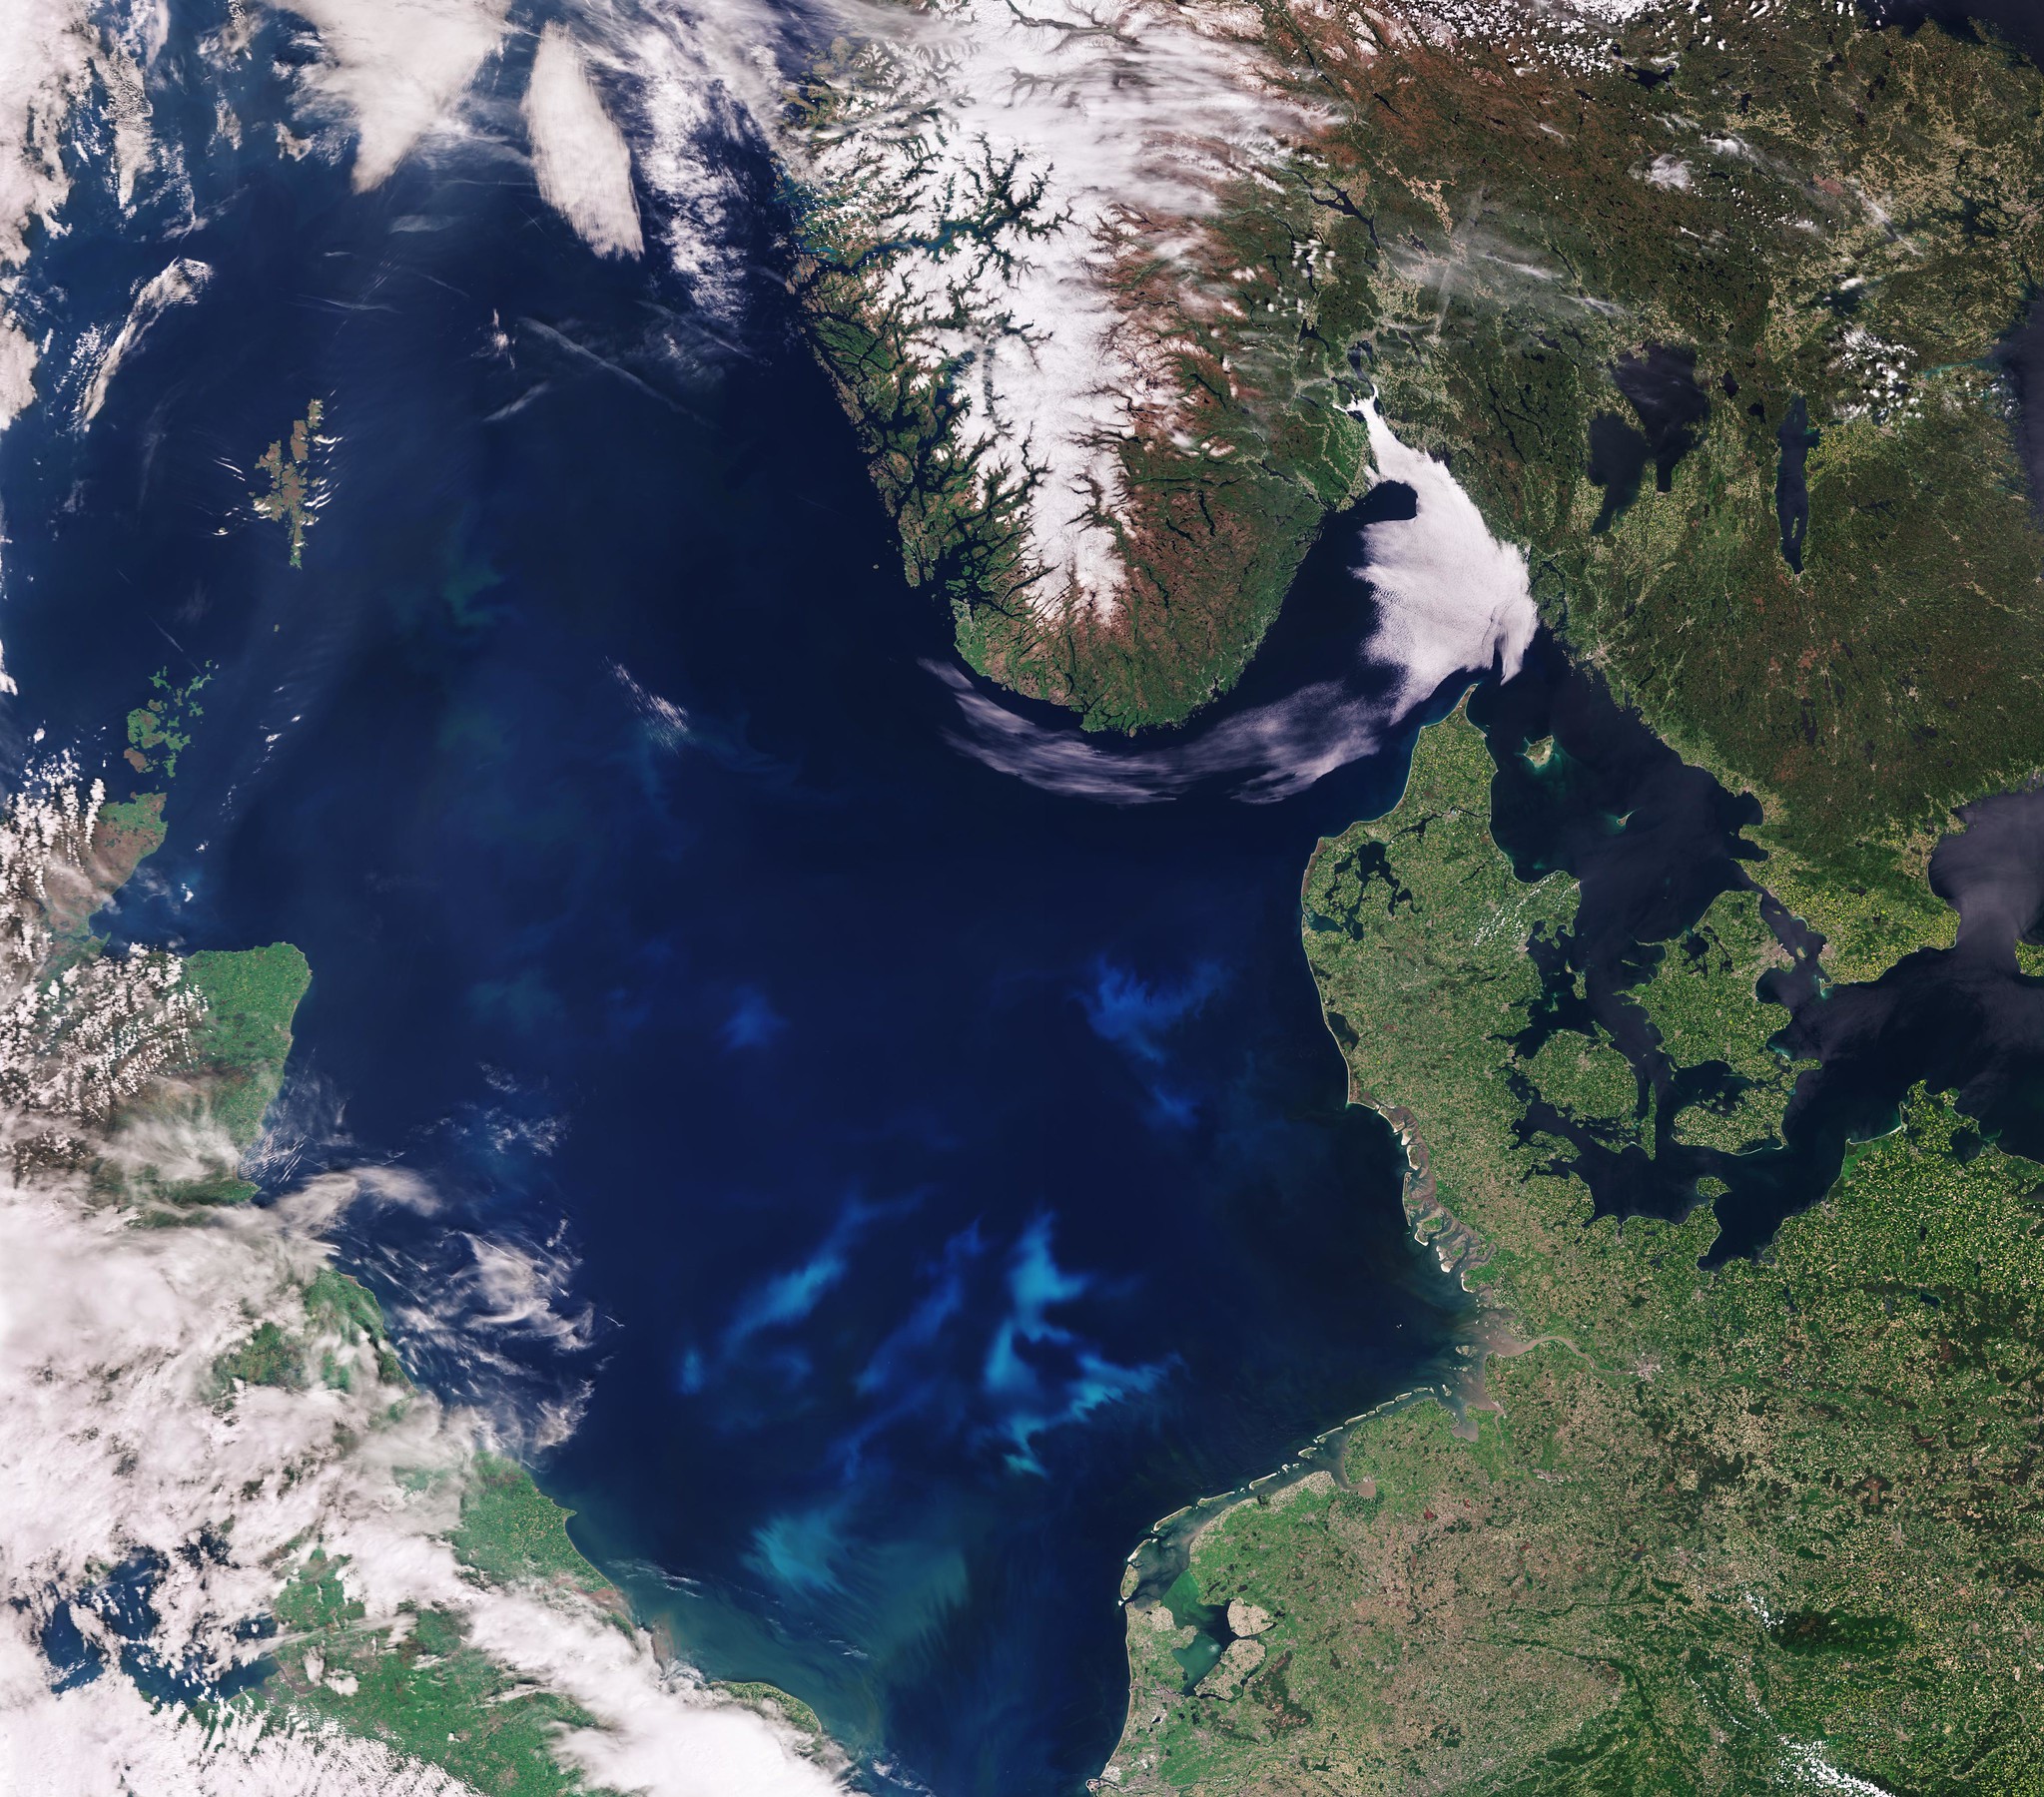
The Copernicus Sentinel-3A satellite captures a significant algae bloom in the North Sea. (Credit: contains modified Copernicus Sentinel data (2017), processed by ESA, CC BY-SA 3.0 IGO).
Methods
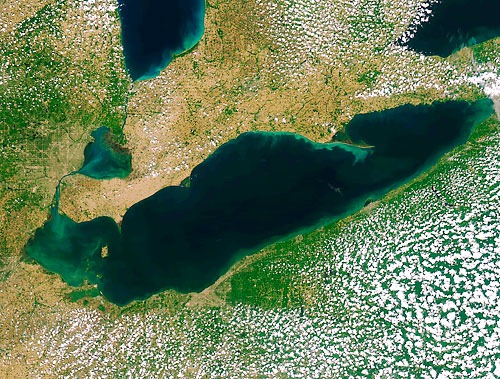
The sixteen available bands of Sentinel-3 images from 2016 to 2021 were used as predictor variables. The 16 available bands of Sentinel-3 images observed the Western basin of Lake Erie and documented visual conditions in the basin over time.
Four proxies of cyanobacterial masses—Chlorophyll-a, Microcystin, Phycocyanin, and Secchi-depth—were collected discretely and considered as response variables in the Random Forest models. Proxy data was collected by NOAA GLERL (240 ground samples) and the Stone Lab Algal and Water Quality Laboratory (127 ground samples).1
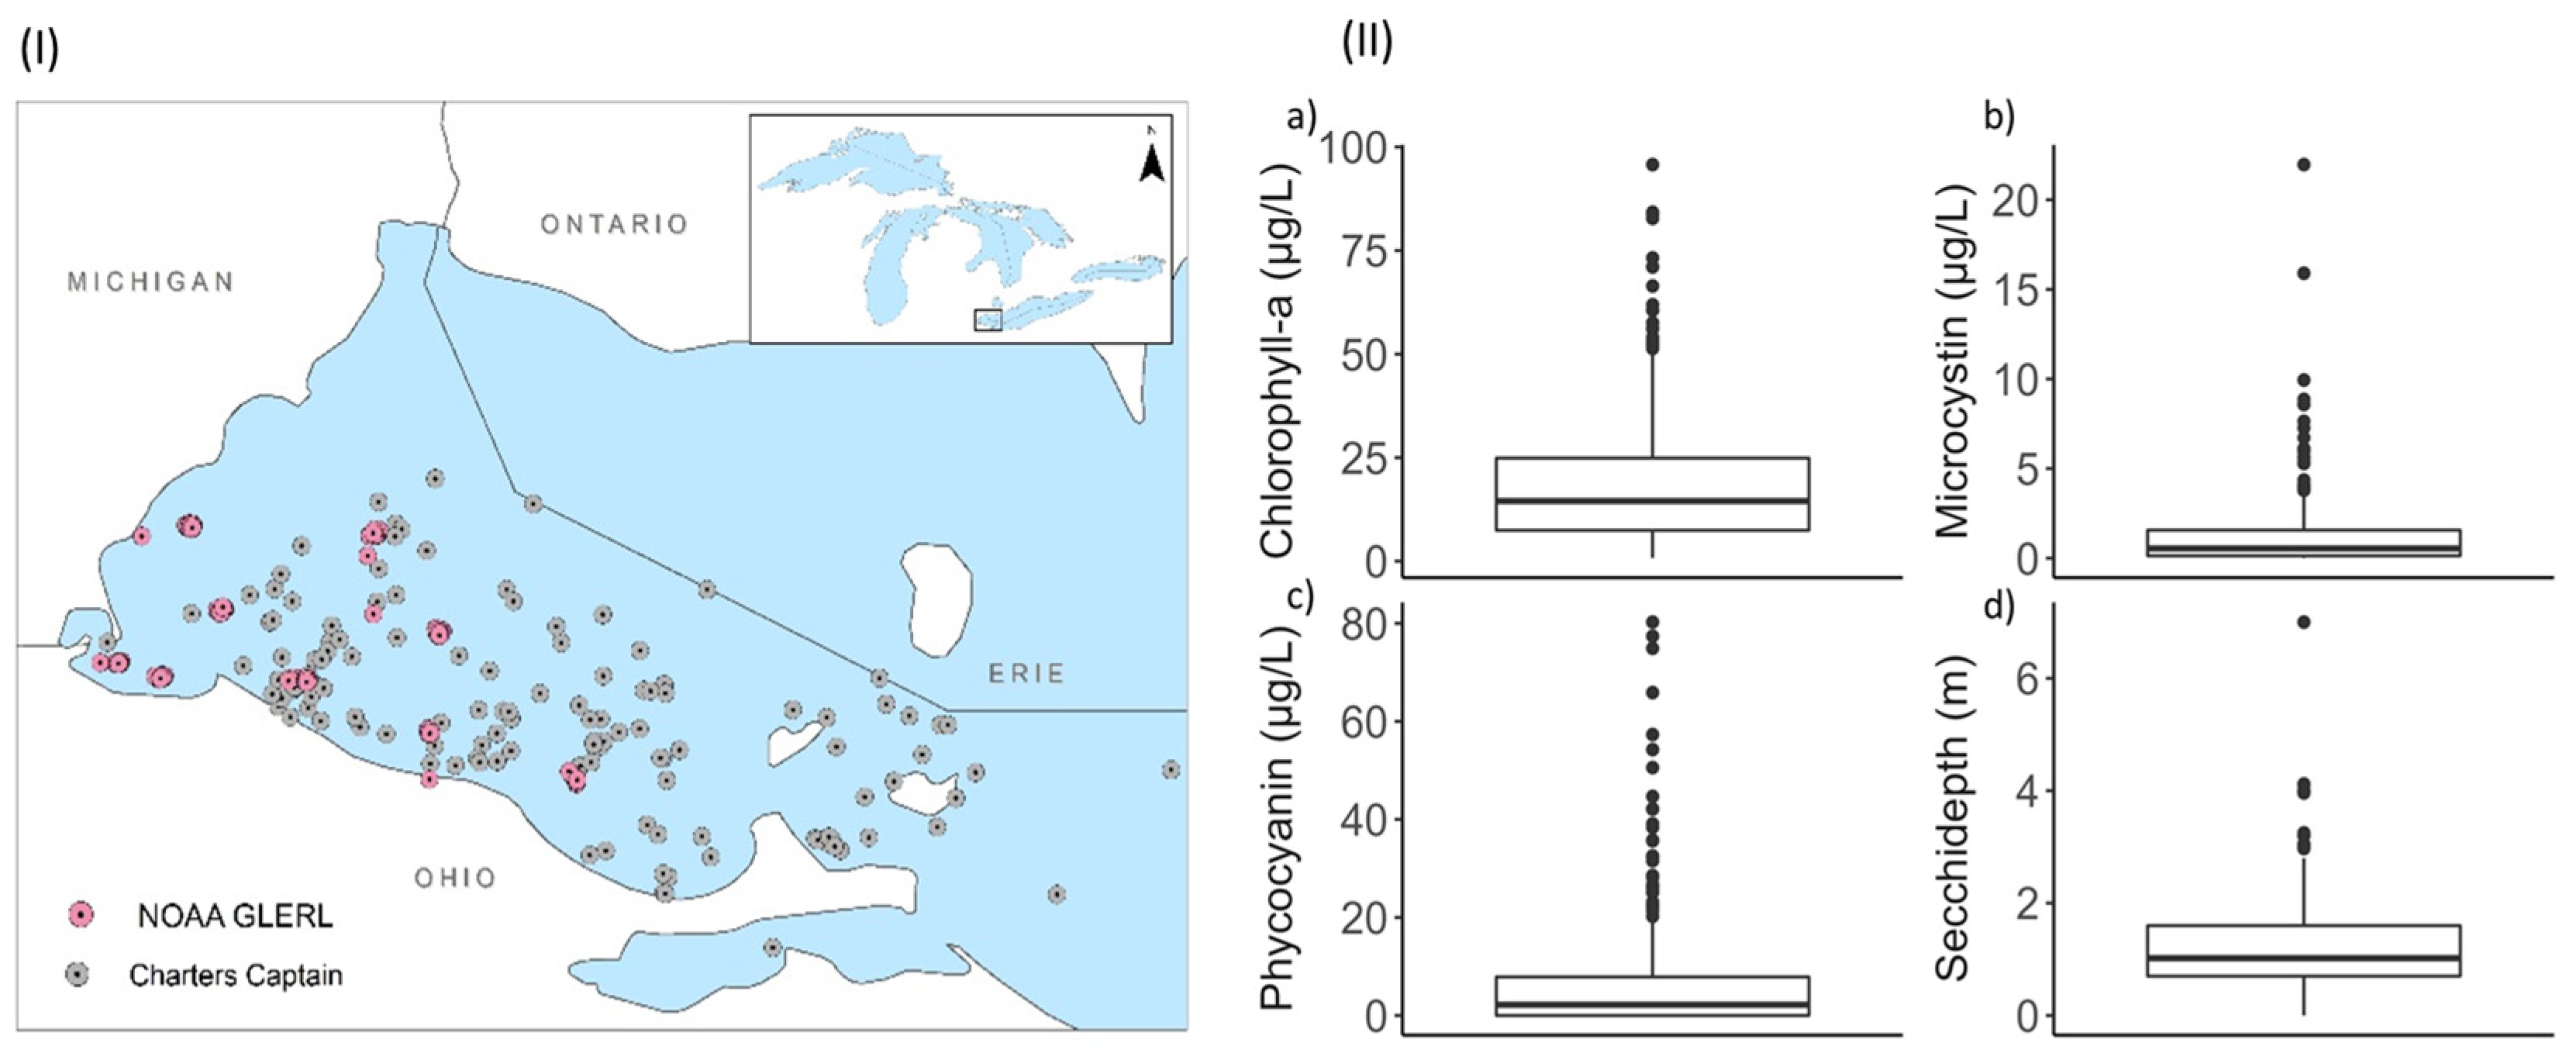
“The location map shows Lake Erie as part of the Great Lakes Basin. (II) Boxplot of the values for algal bloom proxies (a) Chlorophyll-a, (b) Phycocyanin, (c) Microcystin, and (d) Secchi-depth. The box indicates the interquartile range, i.e., 25–75 percentile and the line inside the box shows the median. The dots following the whisker (error bar) represent the outliers.” (Credit: Joshi et al., 2024)
Data from the satellites and discrete sampling efforts were compared to link images to certain conditions in the basin. The resulting Random Forest model allows for the prediction of cyanoHABs by estimating Chlorophyll-a, Microcystin, Phycocyanin, and Secchi-depth in relation to ground observations.
Results
Results indicated varying levels of accuracy and success of the prediction model. Chlorophyll-a exhibited the highest predictability compared to the other proxies, possibly driven by Chlorophyll-a having a higher dominance on harmful algae compared to other variables. The remaining proxies had low accuracy at similar levels.1
While microcystin was expected to have lower accuracy on account of it being a chemical toxin that is hard to detect through remote sensing, Phycocyanin and Secchi-depth were equally low. Fortunately, observations during the peak bloom months of August and September suggest that a considerable portion of Chlorophyll-a can explain the presence of the other proxies.
This prediction model holds great potential in the realm of cyanoHABs monitoring and public health in the future. Such data can inform water resource use and have the potential to be applied elsewhere.
Source
- Joshi, N., Park, J., Zhao, K., Londo, A., & Khanal, S. (2024). Monitoring Harmful Algal Blooms and Water Quality Using Sentinel-3 OLCI Satellite Imagery with Machine Learning. Remote Sensing, 16(13), 2444. https://doi.org/10.3390/rs16132444