


Predictive Modeling Supports Mapping of Ecosystem Services in a Lake Superior Estuary
0
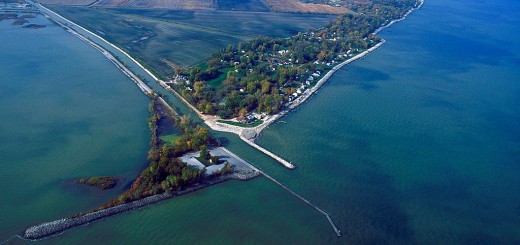
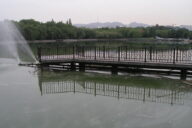
The St. Louis River as seen from Duluth, Minn. (Credit: TheLamplighters via Flickr)
Water bodies provide lots of benefits to those living in or around them. But how do you quantify the benefits so they can be protected?
“We say ecosystem services are the benefits people receive from ecosystems. Quite a few are recreational,” said Ted Angradi, research biologist with the U.S. Environmental Protection Agency based in Duluth, Minn.
When it comes to remediating natural areas, or federally determined Areas Of Concern (AOC), more should be considered – the total benefits of an area need to be weighed. Angradi says developing models that could show an ecosystem’s total services is one of the EPA’s largest goals. A project to map the St. Louis River estuary AOC near Lake Superior serves as an example of what may be to come.
Hydroacoustic instruments and pressure transducers were used to map parts of the estuary. Researchers at the EPA wanted to track submerged aquatic vegetation in the area to see which areas were best for fish spawning. But the largest issue affecting the overall health of the estuary is contaminated sediment, left behind from industrial discharges in the past.
“We’re trying to build predictive models to support habitat restoration,” said Angradi. “In the restoration phase of a rehab, you may be creating more shallow water habitat. But you may want to change the design to get submerged aquatic vegetation (SAV).”
Angradi and David Bolgrien used a small research vessel to run transects across parts of the estuary. Each transect was spaced about 50 meters apart.

Ted Angradi makes a transect across the St. Louis River in an EPA watercraft. (Credit: Pat Collins)
“It’s a shallow water (mapping) technique that we used. There’s other applications for this technology,” said Bolgrien, a research biologist in the same EPA office. “It (hydroacoustics) has a good track record, like other substrate applications in mapping silt and mud.”
Wherever the two surveyed, they recorded wall-to-wall bathymetry data, says Angradi. At the same time, the data revealed where there was vegetation underwater. The dataset was split in half and a predictive model was built. The two used an independent data set collected by another research group and compared what their model predicted to what had been found. “It came out that there was a very good overlap,” said Angradi.

Four areas of the St. Louis River Estuary were surveyed in 2011: Allouez Bay, Superior Bay, St. Louis Bay and Spirit Lake. Survey transects were aligned along a grid of GPS waypoints spaced 50 meters apart. (Credit: Ted Angradi)
“The models give you power to predict,” said Bolgrien. This is an advantage over current methods used in environmental projects.
Bolgrien says that resource managers often look at something specific, like vegetation or sediment, instead of looking at all the services an ecosystem provides. Cleaning up sediment is good, he says, but it’s important to quantify what that yields for the ecosystem overall.
The EPA will also use the approach on a larger scale. “We hope to be able to run some management-type scenarios to see how the delivery of ecosystem services would change with distinctions like climate change,” said Bolgrien. “Everything has to be mappable.”
There are already a few ecosystem models in place, and Angradi says they’re quite responsive. “They’re live maps. An ecosystem services map allows you to track changes in a remediation effort, to track things that aren’t typically tracked.”
If a few features of the ecosystem are changed, the entire system model updates to account for the tweaks. So if a fish species given two meters to spawn in an initial model is found to actually need three meters, that can be updated on the fly. “No part of this is static,” said Angradi. “Everything is in play.”