


Research Summary: Human Influences on Nitrogen Removal in Lakes
0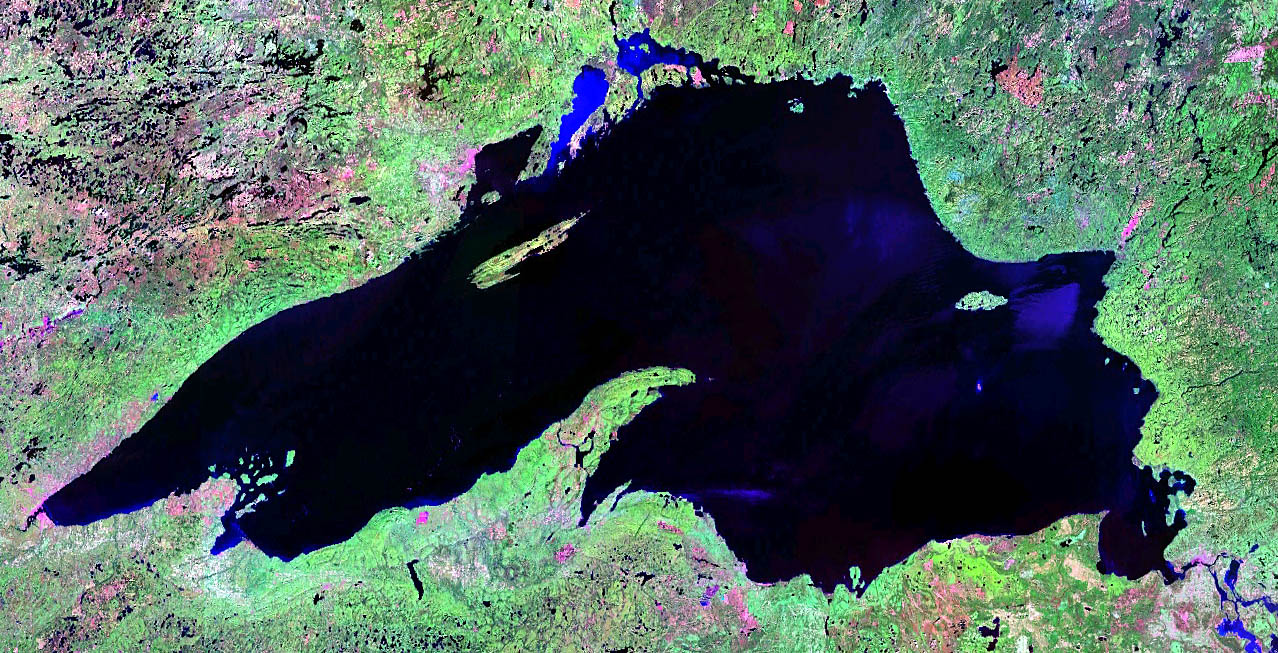
Lake Superior as seen from space. (Credit: NASA)
Human activities have increased the availability of reactive nitrogen in many ecosystems, leading to negative impacts on human health, biodiversity, and water quality. Freshwater ecosystems, including lakes, streams, and wetlands, are a large global sink for reactive nitrogen, but factors that determine the efficacy of freshwater nitrogen removal rates are poorly known. Using a global lake data set, we show that the availability of phosphorus, a limiting nutrient, affects both annual nitrogen removal rate and efficiency. This result indicates that increased phosphorus inputs from human activities have stimulated nitrogen removal processes in many lakes. Recent management-driven reductions in phosphorus availability promote water column accumulation and export of nitrogen from large lakes, an unintended consequence of single-element management that argues for greater control of nitrogen as well as phosphorus sources.
Excess reactive nitrogen (N) from fertilizer use, crop N fixation, fossil fuel combustion, and other sources has led to large changes in ecosystems, including shifts in species composition, reduced biodiversity, and air and water quality impairment (1–3). Processes such as denitrification and long-term storage (burial) in aquatic ecosystems remove substantial fractions of the total N inputs to watersheds (4) and thus provide a valuable ecosystem service by mitigating the impacts of increased human N inputs. A large but variable proportion of aquatic N removal occurs in freshwater ecosystems, including groundwater, wetlands, streams, and lakes (5). Greater understanding of freshwater N removal isrequired to make effectivemanagement decisions to maintain and enhance N removal processes in the face of agricultural intensification and expansion, urbanization, and overall population growth that are increasing water quality degradation (5).
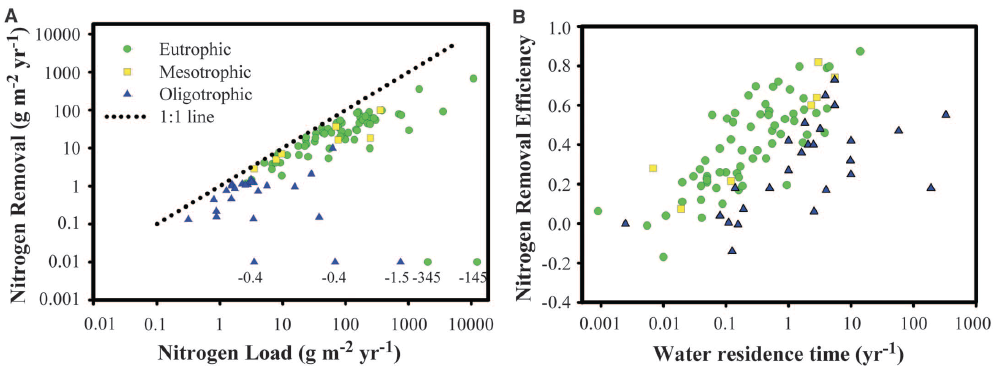
Fig. 1. Major influences on N removal and removal efficiency in lakes and reservoirs. (A) Annual rates of permanent TN removal related to annual N load and site trophic status. (B) Efficiency of TN removal as a function of water residence time and trophic status. Values of 0.01 in (A) were negative, were assumed to be near zero for oligotrophic lakes, and were excluded for the two eutrophic lakes (supplementary text). The actual values are indicated in parentheses. Regression relationships for each lake type are presented in table S2.
We synthesized annual ecosystem-scale mass balance measurements to explore the factors that are associated with permanent N removal in lakes, a globally important yet highly variable sink for N in landscapes (6). To interpret variation in permanent aquatic N removal (defined here as denitrification plus long-term sedimentary burial of organic N), we analyzed physical and biological factors known to affect N cycling and transport, focusing on factors that co-occur with increased external N loading to lakes (supplementary text). In particular,we examined the role of phosphorus (P), a key limiting element in lakes that also has been strongly influenced by human activities (7) and is an important factor in widespread eutrophication in fresh water (8).
Across a diverse and broadly representative set of lakes (supplementary text and table S3), total N (TN) removal rates (grams of Nm−2 year−1) increased with total external TN loading (sum of direct deposition, streams and rivers, and groundwater) (log TNremoval = –0.27 + 0.82 × log TNload; r2 = 0.78) and maintained high removal even under the highest TN loading rates (Fig. 1A). Ecosystem N removal efficiency (NRE, the proportion of TN inputs removed via denitrification or permanent burial) was primarily influenced by water residence time, with longer residence times resulting in increased NRE, and was affected little byNloading rate (Table 1, table S1, and Fig. 1B). These analyses show that lakes can remove a large proportion of TN inputs (up to 90%) from surrounding watersheds, providing important water quality benefits to downstream ecosystems. Although TN loading and water residence time had large influences on TN removal rates and NRE, respectively, as observed previously (9, 10), the availability of P also was found to be an important determinant of N fate (Fig. 1, Table 1, and tables S1 and S2). For similar TN load and water residence time, P-rich eutrophic lakes removed over seven times more N than oligotrophic lakes and were almost three times more efficient in removal of TN loads than were unproductive lakes (Fig. 1).
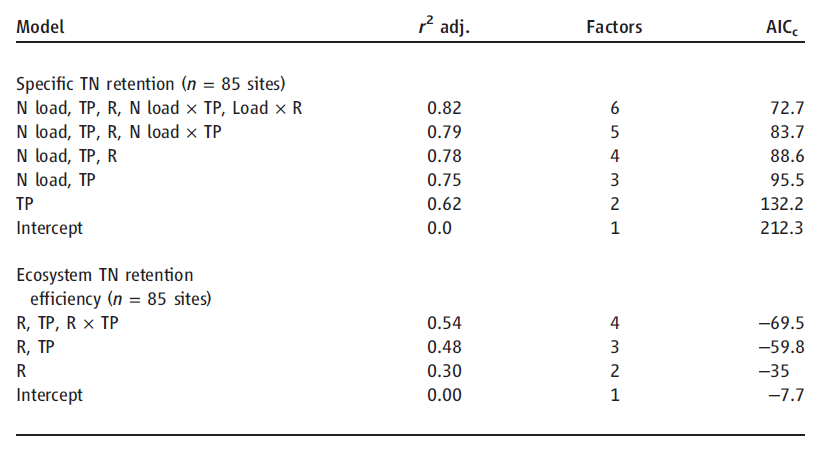
Table 1. Models for N retention in lakes selected using Akaike’s information criterion (AIC) with correction for finite sample sizes [AICc (27)]. Effects of N loading (N load), water residence time (R), and TP and their interactive influences were examined with AICc for relationships to total N removal. For NRE, load was not included in the model based on AICc. r2 adj., r2 adjusted for the number of terms included in the model.
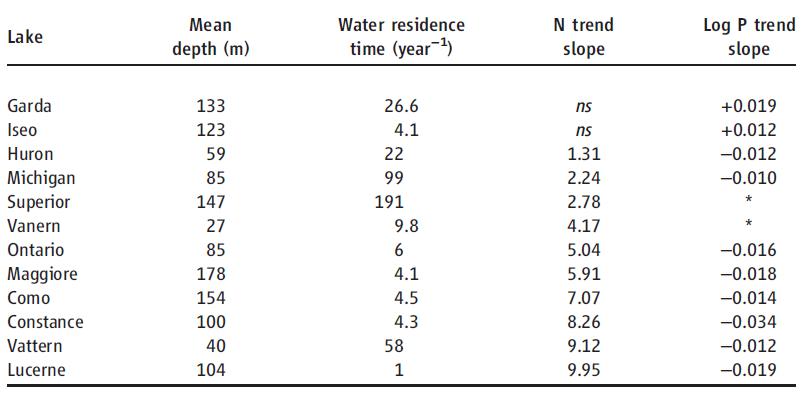
Table 2. Regression analyses of large lake N (mg of N year−1) and P trends (log mg of P year−1). ns, not significant (P > 0.05). TP trends for Lakes Superior and anern were not included because of a lack of reliable P trend data (supplementary text).
The observed influence of P on ecosystem TN removal suggests that lake water column N inventories should be responsive to changes in P availability and trophic status over time. To test this prediction, we examined long-term records of N and P concentration in 12 large lakes with high-resolution data sets and moderate to long water residence times (1 to 191 years; Table 2, supplementary text). Many large lakes in developed watersheds have undergone steep declines in P availability and productivity in response to sewage input controls and watershed management, and N loading has also generally declined or stabilized (18, 19). However, despite reduced or stabilized N loading, N concentrations rose markedly (Fig. 2B) in 10 lakes that also exhibited decreasing total P (TP) or productivity (Fig. 2A and Table 2). These changes increased N:P ratios, indicating growing imbalances between P versus N availability for lake food webs (Fig. 2C). In contrast, large lakes without rising NO3 trends did not show declining TP (Table 2). Together, these results show that large lakes accumulate N under conditions of imbalanced N:P availability.
The observed buildup of N in large lakes with decreasing P and productivity suggests that such systems increasingly lack the capacity to remove N inputs because of a weakened ability to assimilate N and transfer it to benthic denitrification zones. Important differences in the management and cycling of N versus P help explain the increasing mismatch between N and P availability. Controls of P availability in large lakes have been highly effective because of management focused on the reduction of watershed erosion and sewage, two primary human sources of P to aquatic ecosystems (7). In contrast, N management has been less effective because of diverse sources of nonpoint N inputs, including nitrate leaching from soils and atmospheric deposition, which are more difficult to control (20). In contrast to large lakes, smaller lakes show decreasing or stable NO3 and TN trends during recent decades (18, 21). These divergent responses are probably due to rapid hydrologic turnover in small lakes, which obscures trends, as well as the higher availability of P and organic carbon (22) from surrounding watersheds, which may maintain high denitrification rates.
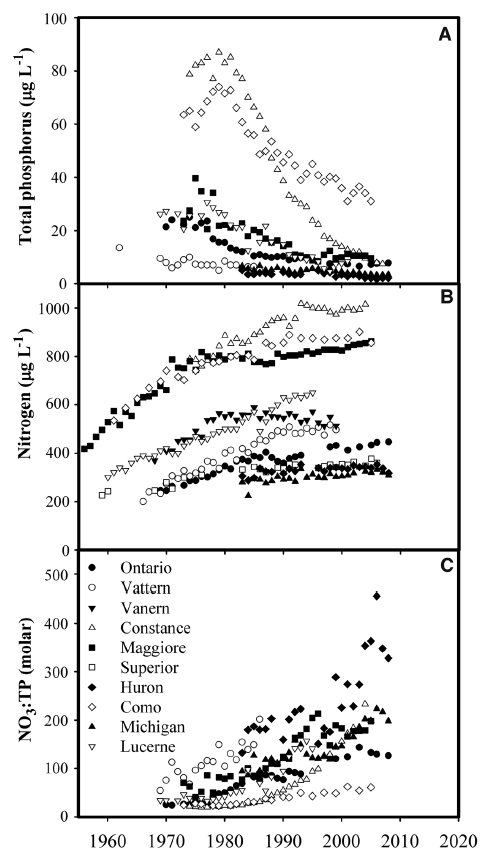
Fig. 2. Management influences nutrient concentration in large lakes. Trends in water column (A) TP, (B) nitrate or dissolved inorganic N (DIN), and (C) NO3:TP or DIN:TP for large lakes with declining TP. TP and nutrient ratio data are not shown for Lake Superior, where TP is near the analytical detection limit, and Lake Vanern, where time series at two locations show poor correspondence and a weak negative trend. Decreased productivity related to declining P availability has been documented in most of these lakes, including Superior and Vanern (see supplementary text for details).
Our results suggest that the P enrichment often accompanying increased anthropogenic N loading has enhanced the metabolism and removal of N in lakes. Where increased N loads are stoichiometrically balanced with adequate P availability, the resulting human-driven enhancement of N removal may strongly reduce in-lake N concentrations and downstream export. The addition of excess N to unproductive P- and organic carbon–poor lakes leads to a stoichiometric imbalance that increases P limitation of phytoplankton and their consumers (23). Under these conditions, water column N accumulation and downstream flushing result, because these lakes lack an efficient mechanism to remove N. Data from large lakes as well as smaller, pristine, oligotrophic lakes strongly affected by atmospheric deposition support these predictions. Lakes with naturally low or reduced P availability (due to effective P trapping in sediments or management actions that have effectively reduced P) exhibit higher concentrations of nitrate than do more productive ones (24).
Excess P has many adverse effects on lakes, and its positive influence on N removal should therefore in no way be considered as a rationale for relaxing P controlmeasures. Our results instead argue for increased attention to control of N sources from agricultural, urban, and fossil fuel sources, along with further reductions in P sources, to counteract negative impacts of N loading. The biological effects of rising N and N:P imbalances in lakes are incompletely known but may include reduced diversity and consumer growth rates (23). Furthermore, nitrate accumulation can eventually harm drinking water for human population centers that rely on lakes for water. Finally, accumulating N in lakes leads to increased fluvial export of N to downstream N-limited freshwater ecosystems and coastal zones, where it has been shown to stimulate algal blooms and drive a host of other water- and air-quality impairments (16, 25). Greater reduction of N loads via management changes will be difficult given that the sources of N are more diffuse than those of P, yet essential given the negative impacts of high aquatic N concentrations, the increasingly widespread implementation of P controls, and the likelihood of sustained release of reactive N from agricultural intensification and fossil fuel combustion (2, 26).
Full study published 2013 in the journal Science (342): 247 – 249. Additional study authors include Gaston E. Small and Robert W. Sterner.
Acknowledgements
Data used in the analyses on nitrogen removal and the sources of these data are described in the supplementary materials (table S3). This research was supported by NSF under grant OCE-0927512.
References
1. P. M. Vitousek et al., Ecol. Appl. 7, 737–750 (1997).
2. J. N. Galloway et al., Science 320, 889–892 (2008).
3. E. C. Suddick, P. Whitney, A. R. Townsend, E. A. Davidson, Biogeochemistry 114, 1–10 (2013).
4. W. H. Schlesinger, Proc. Natl. Acad. Sci. U.S.A. 106, 203–208 (2009).
5. S. Seitzinger et al., Ecol. Appl. 16, 2064–2090 (2006).
6. J. A. Harrison et al., Biogeochemistry 93, 143–157 (2009).
7. D. W. Schindler, Limnol. Oceanogr. 51, 356–363 (2006).
8. D. W. Schindler, Proc. Biol. Sci. 279, 4322–4333 (2012).
9. D. L. Saunders, J. Kalff, Hydrobiologia 443, 205–212 (2001).
10. S. P. Seitzinger, Limnol. Oceanogr. 33, 702–724 (1988).
11. G. Small, J. Cotner, J. Finlay, R. Stark, R. Sterner, Hydrobiologia 10.1007/s10750-013-1569-7 (2013).
12. G. Tartari, G. Biasci, Water Air Soil Pollut. 99, 523 (1997).
13. O. Kaste, A. Lyche-Solheim, Can. J. Fish. Aquat. Sci. 62, 312–321 (2005).
14. B. J. Peterson et al., Science 229, 1383–1386 (1985).
15. W. Davison, D. G. George, N. J. A. Edwards, Nature 377, 504–507 (1995).
16. R. Howarth et al., Front. Ecol. Environ 9, 18–26 (2011).
17. P. G. Taylor, A. R. Townsend, Nature 464, 1178–1181 (2010).
18. E. Jeppesen et al., Freshw. Biol. 50, 1747–1771 (2005).
19. D. Gerdeaux, O. Anneville, D. Hefti, Acta Oecol. 30, 161–167 (2006).
20. S. R. Carpenter et al., Ecol. Appl. 8, 559–568 (1998).
21. G. A. Weyhenmeyer et al., Limnol. Oceanogr. 52, 1346–1353 (2007).
22. J. J. Cole et al., Ecosystems 10, 171–184 (2007).
23. J. J. Elser et al., Science 326, 835–837 (2009).
24. P. Hohener, R. Gachter, Aquat. Sci. 55, 112–131 (1993).
25. J. S. Baron et al., Biogeochemistry 114, 71–92 (2013).
26. P. M. Vitousek et al., Science 324, 1519–1520 (2009).
27. K. P. Burnham, D. R. Anderson, Model Selection and Multi-Model Inference (Springer, New York, ed. 2, 2002).
Supplementary Materials
www.sciencemag.org/content/342/6155/247/suppl/DC1
Materials and Methods
Tables S1 to S3
References (28–86)