


Research Brief: Understanding the Influence of Changing Ice Penology on Under-Ice Temperature Dynamics
0Mohonk Lake on the Shawangunk Ridge in New York has been monitored for nearly a century by a local family, providing annual ice-on and ice-off observations since 1932. These observations, paired with real-time and modeled thermal structure, help reveal how changing ice phenology influences temperature dynamics under the ice.
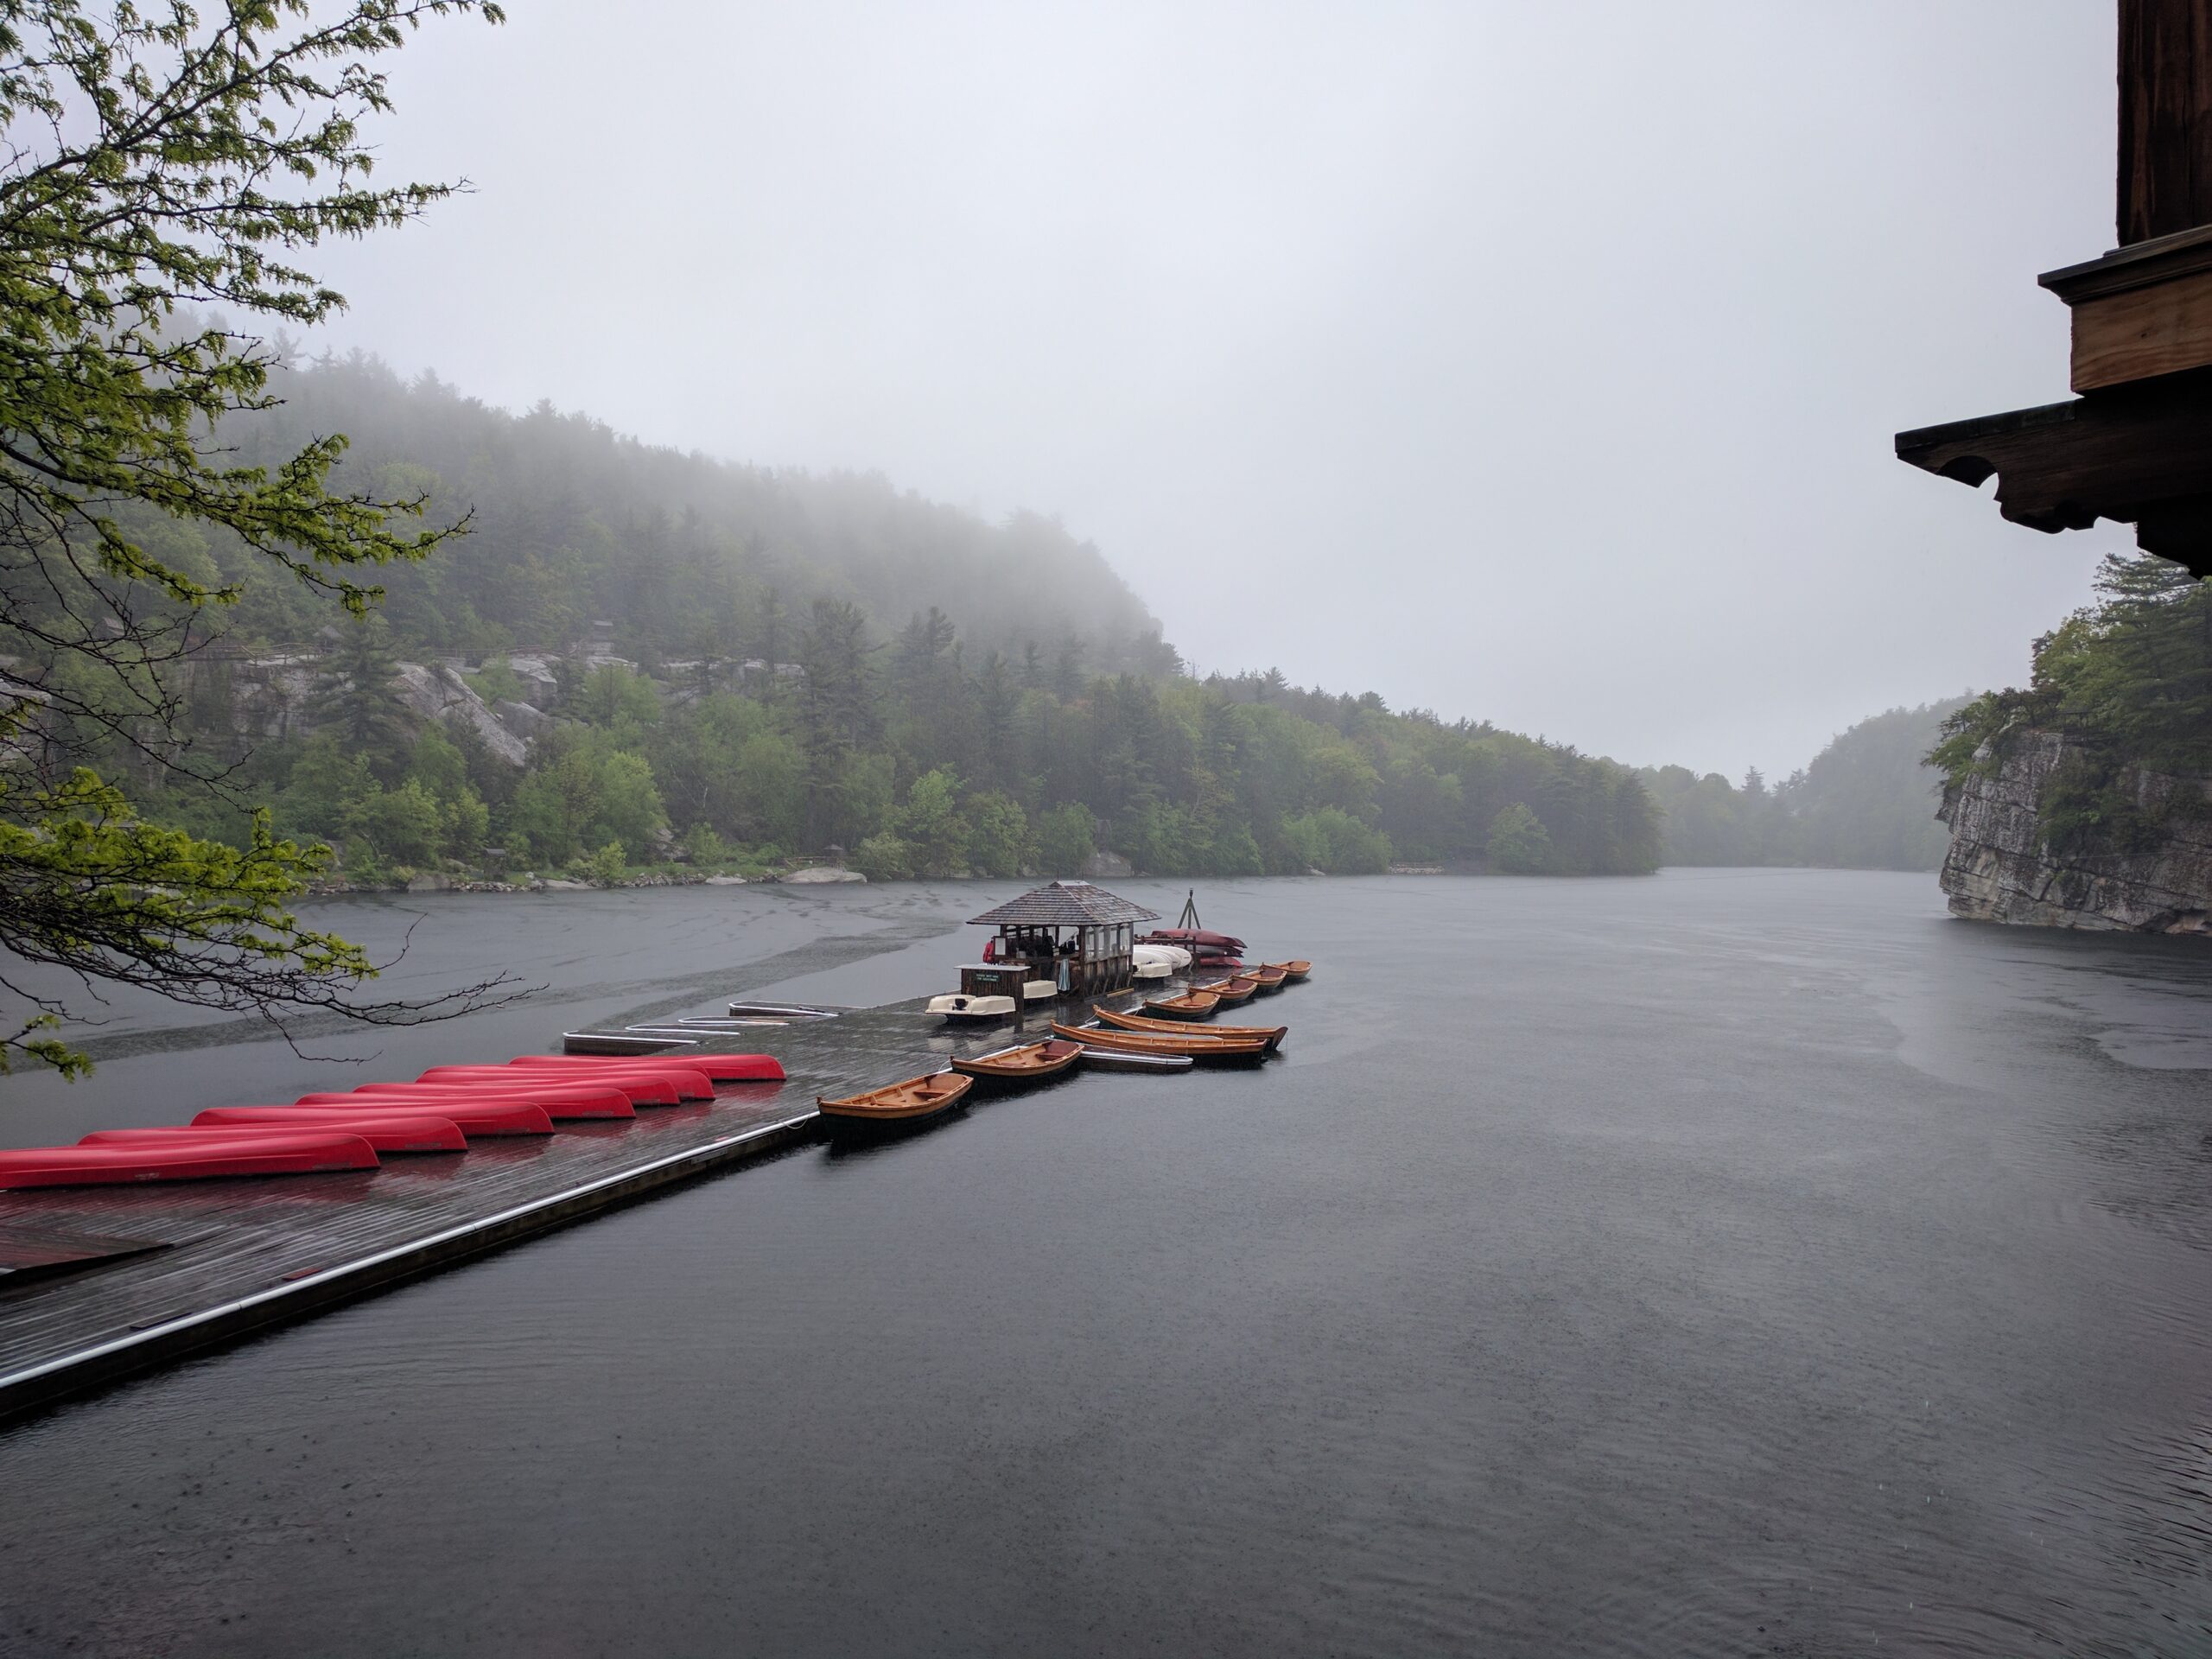
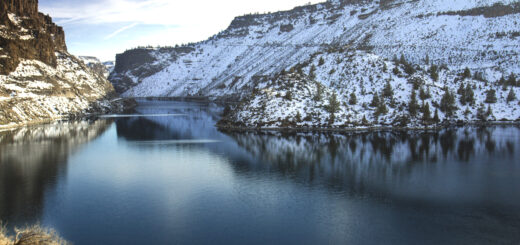
A boat dock at the edge of Lake Mohonk, as seen from just outside Mohonk Mountain House. (Credit: Grendelkhan via Wikimedia Commons CC BY-SA 3.0)
A 2024 study published in the Journal of Geophysical Research aimed to study temperature data and ice conditions on Mohonk Lake to examine the relationship between climate, ice phenology, and temperature dynamics.1
More specifically, the study sought to answer whether ice phenology and variability are changing and how local and global climate variables impact lake ice phenology. Additionally, the study examined how ice impacted underwater winter stratification, mixing, and temperature dynamics.
The team hypothesized that the timing of ice formation would be driven primarily by air temperatures in the late fall and early winter. Similarly, it was expected that ice-off would be controlled by spring air temperatures and cumulative snowfall. Finally, the timing of ice-on, ice-off, and overall ice duration was expected to influence under-ice temperatures.
Methods
In addition to the 92-year Mohonk Lake ice record, the study incorporated snow precipitation data from a National Weather Service station over the same time period.
From 1985 to 2023, profiles of lake temperature were taken weekly at 1 m increments and from 2016 to 2018, high‐frequency (15‐min) temperature data were continuously collected using NexSens T‐Node temperature loggers at 1‐m intervals from the surface to 9 m deep.
The combination of the 92-year ice cover record paired with the 2 years of high-frequency data helps to paint a clearer picture of how ice cover and under-ice temperature dynamics are related.
Results
Between 1932 and 2023, ice-on dates ranged between December 5th and February 9th—and ice-off dates ranged between March 11th and May 2nd. Over the course of the study, ice-on dates trended later in the season, but there was no significant change in ice-off dates, leading to shorter ice durations overall.
Late fall and early winter air temperatures were strong drivers of ice-on timing in Mohonk Lake. Ice-off was controlled by a combination of late winter and spring precipitation and air temperature.1
Variation in ice duration was partially explained by trends in global temperature and variances in November and December North Atlantic Oscillation cycles. Overall, higher global temperatures since the early 20th century correlated with shorter ice duration.
Source
- Oleksy, I., & Richardson, D.C. (2024). Shorter Ice Duration and Changing Phenology Influence Under‐Ice Lake Temperature Dynamics. Journal of Geophysical Research. Biogeosciences, 129.